secml.figure
CFigure
-
class
secml.figure.c_figure.CFigure(height=6, width=6, title='', fontsize=12, linewidth=2, markersize=7)[source]¶ Bases:
secml.core.c_creator.CCreatorCreates a Figure.
A Figure is a collection of subplots. The last active subplot can be accessed by calling CFigure.sp`, followed by the desired plotting function (plot, scatter, contour, etc.). Each subplot is identified by an index (grid slot) inside an imaginary grid (n_rows, n_columns, grid_slot), counting from left to right, from top to bottom. By default, a subplot is created in a single-row, single-column imaginary grid (1, 1, 1).
- Parameters
- heightscalar, optional
Height of the new figure. Default 6.
- widthscalar, optional
Width of the new figure. Default 6.
- titlestr, optional
Super title of the new figure. This is not the subplot title. To set a title for active subplot use
subtitle. Default is to not set a super title.- linewidthfloat, optional
Define default linewidth for all subplots. Default 2.
- fontsizeint, optional
Define default fontsize for all subplots. Default 12.
- markersizescalar, optional
Define default markersize for all subplots. Default 7.
Notes
Not all matplotlib methods and/or parameters are currently available. If needed, directly access the matplotlib.Axes active subplot instance through the CFigure.sp._sp parameter.
Examples
>>> from secml.figure import CFigure
>>> fig = CFigure(fontsize=14)
>>> fig.sp.plot([0, 1], color='red')
>>> fig.show() # This will open a new window with the figure
- Attributes
Methods
close(self[, fig])Close current or input figure.
copy(self)Returns a shallow copy of current class.
create([class_item])This method creates an instance of a class with given type.
deepcopy(self)Returns a deep copy of current class.
get_class_from_type(class_type)Return the class associated with input type.
get_default_params(self)Return current defaults for the figure.
get_params(self)Returns the dictionary of class hyperparameters.
get_state(self)Returns the object state dictionary.
get_subclasses()Get all the subclasses of the calling class.
list_class_types()This method lists all types of available subclasses of calling one.
load(path)Loads object from file.
load_state(self, path)Sets the object state from file.
save(self, path)Save class object to file.
save_state(self, path)Store the object state to file.
savefig(self, fname[, dpi, facecolor, …])Save figure to disk.
set(self, param_name, param_value[, copy])Set a parameter of the class.
set_params(self, params_dict[, copy])Set all parameters passed as a dictionary {key: value}.
set_state(self, state_dict[, copy])Sets the object state using input dictionary.
show([block])Show all created figures.
subplot(self[, n_rows, n_cols, grid_slot])Create a new subplot into specific position.
subplots_adjust(self[, left, right, bottom, …])Tune the subplot layout.
tight_layout(self[, pad, h_pad, w_pad, rect])Adjust space between plot and figure.
timed([msg])Timer decorator.
title(self, label, **kwargs)Set the global title for current figure.
-
close(self, fig=None)[source]¶ Close current or input figure.
- Parameters
- figCFigure or None
Handle to figure to close. If None (default), current figure is closed.
-
get_default_params(self)[source]¶ Return current defaults for the figure.
- Returns
- default_parametersdict
Contain default parameters value set.
-
get_state(self)[source]¶ Returns the object state dictionary.
- Returns
- dict
Dictionary containing the state of the object.
-
load_state(self, path)[source]¶ Sets the object state from file.
- Parameters
- pathstr
The full path of the file from which to load the object state.
See also
set_stateSets the object state using input dictionary.
-
property
n_sp¶ Returns the number of created subplots.
-
save_state(self, path)[source]¶ Store the object state to file.
- Parameters
- pathstr
Path of the file where to store object state.
- Returns
- str
The full path of the stored object.
See also
get_stateReturns the object state dictionary.
-
savefig(self, fname, dpi=None, facecolor='w', edgecolor='w', orientation='portrait', file_format=None, transparent=False, bbox_inches=None, bbox_extra_artists=None, pad_inches=0.1)[source]¶ Save figure to disk.
- Parameters
- fnamestring
containing a path to a filename, or a Python file-like object. If file_format is None and fname is a string, the output file_format is deduced from the extension of the filename. If the filename has no extension, the value of the rc parameter savefig.file_format is used. If fname is not a string, remember to specify file_format to ensure that the correct backend is used.
- dpi[ None | scalar > 0 ], optional
The resolution in dots per inch. If None it will default to the value savefig.dpi in the matplotlibrc file.
- facecolor, edgecolorcolor or str, optional
The colors of the figure rectangle. Default ‘w’ (white).
- orientation: [ ‘landscape’ | ‘portrait’ ], optional
not supported on all backends; currently only on postscript output
- file_formatstr, optional
One of the file extensions supported by the active backend. Most backends support png, pdf, ps, eps and svg.
- transparentbool, optional
If True, the axes patches will all be transparent; the figure patch will also be transparent unless facecolor and/or edgecolor are specified via kwargs. This is useful, for example, for displaying a plot on top of a colored background on a web page. The transparency of these patches will be restored to their original values upon exit of this function.
- bbox_inchesscalar or str, optional
Bbox in inches. Only the given portion of the figure is saved. If ‘tight’, try to figure out the tight bbox of the figure.
- bbox_extra_artistslist
A list of extra artists that will be considered when the tight bbox is calculated.
- pad_inchesscalar
Amount of padding around the figure when bbox_inches is ‘tight’.
-
set_state(self, state_dict, copy=False)[source]¶ Sets the object state using input dictionary.
Only readable attributes of the class, i.e. PUBLIC or READ/WRITE or READ ONLY, can be set.
If possible, a reference to the attribute to set is assigned. Use copy=True to always make a deepcopy before set.
- Parameters
- state_dictdict
Dictionary containing the state of the object.
- copybool, optional
By default (False) a reference to the attribute to assign is set. If True or a reference cannot be extracted, a deepcopy of the attribute is done first.
-
static
show(block=True)[source]¶ Show all created figures.
- Parameters
- blockboolean, default True
If true, execution is halted until the showed figure(s) are closed.
-
property
sp¶ Return reference to active subplot class.
If no subplot is available, creates a new standard subplot in (1,1,1) position and returns its reference.
-
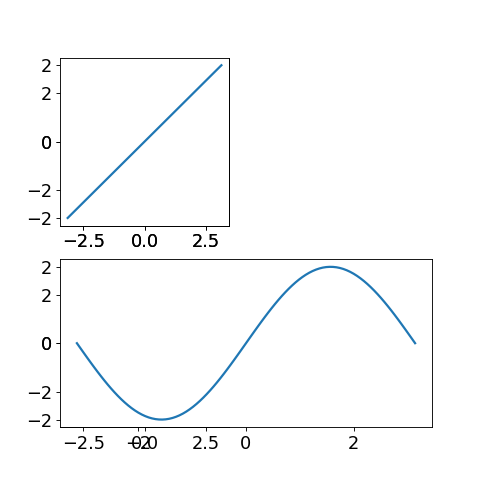
subplot(self, n_rows=1, n_cols=1, grid_slot=1, **kwargs)[source]¶ Create a new subplot into specific position.
Creates a new subplot placing it in the n_plot position of the n_rows * n_cols imaginary grid. Position is indexed in raster-scan.
- If subplot is created in a slot occupied by another subplot,
old subplot will be used.
- Parameters
- n_rowsint
Number of rows of the imaginary grid used for subdividing the figure. Default 1 (one row).
- n_colsint
Number of columns of the imaginary grid used for subdividing the figure. Default 1 (one column).
- grid_slotint or tuple
If int, raster scan position of the new subplot. Default 1. If tuple, index of the slot of the grid. Each dimension can be specified as an int or a slice, e.g. in a 3 x 3 subplot grid, grid_slot=(0, slice(1, 3)) will create a subplot at row index 0 that spans between columns index 1 and 2.
Examples
import numpy as np
import matplotlib.pyplot as plt
from secml.figure import CFigure

fig = CFigure(fontsize=16)

# create a new subplot
fig.subplot(2, 2, 1)
x = np.linspace(-np.pi, np.pi, 100)
y = 2*np.sin(x)
# function `plot` will be applied to the last subplot created
fig.sp.plot(x, y)

# subplot indices are are the same of the first subplot
# so the following function will be run inside the previous plot
fig.subplot(2, 2, 1)
y = x
fig.sp.plot(x, y)

# create a new subplot
fig.subplot(2, 2, 3)
fig.sp.plot(x, y)

fig.subplot(2, 2, grid_slot=(1, slice(2)))
y = 2*np.sin(x)
fig.sp.plot(x, y)

plt.show()
(Source code, png)

-
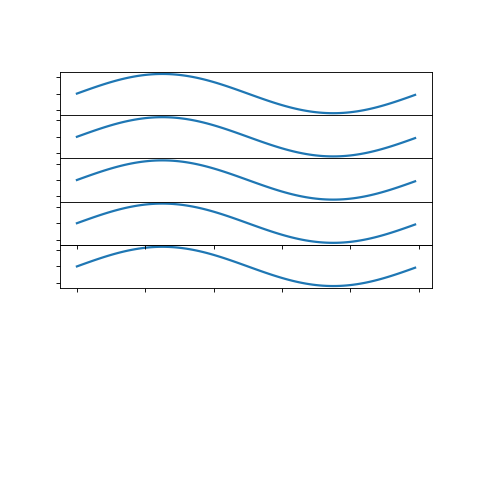
subplots_adjust(self, left=0.125, right=0.9, bottom=0.1, top=0.9, wspace=0.2, hspace=0.2)[source]¶ Tune the subplot layout.
- Parameters
- leftfloat, default 0.125
Left side of the subplots.
- rightfloat, default 0.9
Right side of the subplots.
- bottomfloat, default 0.1
Bottom of the subplots.
- topfloat, default 0.9
Top of the subplots.
- wspacefloat, default 0.2
Amount of width reserved for blank space between subplots.
- hspacefloat, default 0.2
Amount of height reserved for white space between subplots
Examples
from secml.array import CArray
from secml.figure import CFigure

n = 5
fig = CFigure()

x = CArray.arange(100)
y = 3. * CArray.sin(x * 2. * 3.14 / 100.)

for i in range(n):
    temp = 510 + i
    sp = fig.subplot(n, 1, i)
    fig.sp.plot(x, y)
    # for add space from the figure's border you must increased default value parameters
    fig.subplots_adjust(bottom=0.4, top=0.85, hspace=0.001)
    fig.sp.xticklabels(())
    fig.sp.yticklabels(())

fig.show()
(Source code, png)
-
tight_layout(self, pad=1.08, h_pad=None, w_pad=None, rect=None)[source]¶ Adjust space between plot and figure.
- Parameters
- padfloat, default 1.08
Padding between the figure edge and the edges of subplots, as a fraction of the font-size.
- h_pad, w_padfloat, defaults to pad_inches.
padding (height/width) between edges of adjacent subplots.
- recttuple of scalars, default is (0, 0, 1, 1).
(left, bottom, right, top) in the normalized figure coordinate that the whole subplots area (including labels) will fit into.
CPlot
All methods provided by CPlot and subclasses are available
by calling the active subplot via CFigure.sp
Warning
To be never explicitly instanced. Will be created by CFigure.
-
class
secml.figure._plots.c_plot.CPlot(sp, default_params)[source]¶ Interface for standard plots.
This class provides an interface and few other methods useful for standard plot creation.
To be never explicitly instanced. Will be created by CFigure.
- Parameters
- spAxes
Subplot to use for plotting. Instance of matplotlib.axes.Axes.
- default_paramsdict
Dictionary with default parameters.
See also
CFigurecreates and handle figures.
- Attributes
class_typeDefines class type.
loggerLogger for current object.
n_linesReturns the number of lines inside current subplot.
verboseVerbosity level of logger output.
Methods
bar(self, left, height[, width, bottom])Bar plot.
barh(self, bottom, width[, height, left])Horizontal bar plot.
boxplot(self, x[, notch, sym, vert, whis, …])Make a box and whisker plot.
clabel(self, contour, *args, **kwargs)Label a contour plot.
colorbar(self, mappable[, ticks])Add colorbar to plot.
contour(self, x, y, z, *args, **kwargs)Draw contour lines of a function.
contourf(self, x, y, z, *args, **kwargs)Draw filled contour of a function.
copy(self)Returns a shallow copy of current class.
create([class_item])This method creates an instance of a class with given type.
deepcopy(self)Returns a deep copy of current class.
errorbar(self, x, y[, xerr, yerr])Plot with error deltas in yerr and xerr.
fill_between(self, x, y1[, y2, where, …])Fill the area between two horizontal curves.
get_class_from_type(class_type)Return the class associated with input type.
get_legend(self)Returns the handler of current subplot legend.
Return handles and labels for legend contained by the subplot.
get_lines(self)Return a list of lines contained by the subplot.
get_params(self)Returns the dictionary of class hyperparameters.
get_state(self)Returns the object state dictionary.
get_subclasses()Get all the subclasses of the calling class.
get_xticks_idx(self, xticks)Returns the position of markers to plot.
grid(self[, grid_on, axis])Draw grid for current plot.
hist(self, x, *args, **kwargs)Plot a histogram.
imshow(self, img, *args, **kwargs)Plot image.
legend(self, *args, **kwargs)Create legend for plot.
list_class_types()This method lists all types of available subclasses of calling one.
load(path)Loads object from file.
load_state(self, path)Sets the object state from file.
loglog(self, x[, y])Plot with log scaling on both the x and y axis.
matshow(self, array, *args, **kwargs)Plot an array as a matrix.
merge(self, sp)Merge input subplot to active subplot.
plot(self, x[, y])Plot a line.
plot_path(self, path[, path_style, …])Plot a path traversed by a point.
quiver(self, U, V[, X, Y, color, linestyle, …])A quiver plot displays velocity vectors as arrows with components (u,v) at the points (x,y).
save(self, path)Save class object to file.
save_state(self, path)Store the object state to file.
scatter(self, x, y[, s, c])Scatter plot of x vs y.
semilogx(self, x[, y])Plot with log scaling on the x axis.
semilogy(self, x[, y])Plot with log scaling on the y axis.
set(self, param_name, param_value[, copy])Set a parameter of the class.
set_axisbelow(self[, axisbelow])Set axis ticks and gridlines below most artists.
set_params(self, params_dict[, copy])Set all parameters passed as a dictionary {key: value}.
set_state(self, state_dict[, copy])Sets the object state using input dictionary.
text(self, *args, **kwargs)Create a Text instance at x, y with string text.
tick_params(self, *args, **kwargs)Change the appearance of ticks and tick labels.
timed([msg])Timer decorator.
title(self, text, *args, **kwargs)Set a title for subplot.
xlabel(self, label, *args, **kwargs)Set a label for the x axis.
xlim(self[, bottom, top])Set axes x limits.
xscale(self, scale_type[, nonposx, basex])Set scale for x axis.
xticklabels(self, labels, *args, **kwargs)Set the xtick labels.
xticks(self, location_array, *args, **kwargs)Set the x-tick locations and labels.
ylabel(self, label, *args, **kwargs)Set a label for the y axis
ylim(self[, bottom, top])Set axes y limits.
yscale(self, scale_type[, nonposy, basey])Set scale for y axis.
yticklabels(self, labels, *args, **kwargs)Set the ytick labels.
yticks(self, location_array, *args, **kwargs)Set the y-tick locations and labels.
-
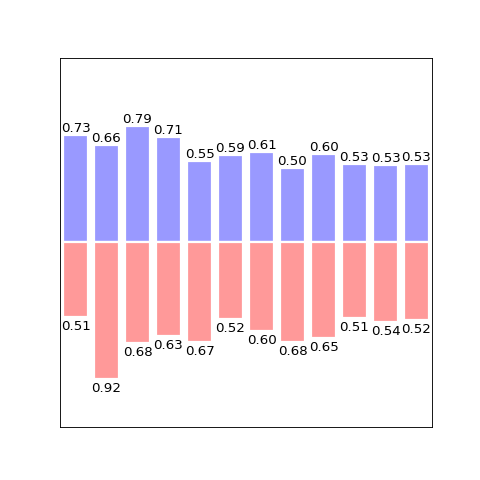
bar(self, left, height, width=0.8, bottom=None, *args, **kwargs)[source]¶ Bar plot.
- Parameters
- leftsequence of scalars
x coordinates of the left sides of the bars.
- heightsequence of scalars
height(s) of the bars.
- widthscalar or array-like, optional, default: 0.8
width(s) of the bars.
- bottomscalar or array-like, optional, default: None
y coordinate(s) of the bars.
- colorscalar or array-like, optional
Colors of the bar faces.
- edgecolorscalar or array-like, optional
Colors of the bar edges.
- linewidthscalar or array-like, optional, default: None
Width of bar edge(s). If None, use default linewidth; If 0, don’t draw edges.
- xerrscalar or array-like, optional, default: None
If not None, will be used to generate errorbar(s) on the bar chart.
- yerrscalar or array-like, optional, default: None
If not None, will be used to generate errorbar(s) on the bar chart.
- ecolorscalar or array-like, optional, default: None
Specifies the color of errorbar(s)
- capsizeinteger, optional, default: 3
Determines the length in points of the error bar caps.
- error_kwdict
dictionary of kwargs to be passed to errorbar method. ecolor and capsize may be specified here rather than independent kwargs.
- align[‘edge’ | ‘center’], optional, default: ‘edge’
If edge, aligns bars by their left edges (for vertical bars) and by their bottom edges (for horizontal bars). If center, interpret the left argument as the coordinates of the centers of the bars.
- orientation‘vertical’ | ‘horizontal’, optional, default: ‘vertical’
The orientation of the bars.
- logboolean, optional, default: False
If true, sets the axis to be log scale.
- Returns
- bar_listlist of bar type objects
Examples
from secml.array import CArray
from secml.figure import CFigure

fig = CFigure(fontsize=12)

n = 12
X = CArray.arange(n)
Y1 = (1 - X / float(n)) * (1.0 - 0.5) * CArray.rand((n,)) + 0.5
Y2 = (1 - X / float(n)) * (1.0 - 0.5) * CArray.rand((n,)) + 0.5

fig.sp.xticks([0.025, 0.025, 0.95, 0.95])
fig.sp.bar(X, Y1, facecolor='#9999ff', edgecolor='white')
fig.sp.bar(X, -Y2, facecolor='#ff9999', edgecolor='white')

for x, y in zip(X, Y1):
    fig.sp.text(x, y, '%.2f' % y, ha='center', va='bottom')

for x, y in zip(X, Y2):
    fig.sp.text(x, -y - 0.02, '%.2f' % y, ha='center', va='top')

fig.sp.xlim(-.5, n-.5)
fig.sp.xticks(())
fig.sp.ylim(-1.25, 1.25)
fig.sp.yticks(())

fig.sp.grid()
fig.show()
(Source code, png)
-
barh(self, bottom, width, height=0.8, left=None, *args, **kwargs)[source]¶ Horizontal bar plot.
- Parameters
- bottomsequence of scalars
y coordinates of the bars.
- widthsequence of scalars
width(s) of the bars.
- heightscalar or array-like, optional, default: 0.8
height(s) of the bars.
- leftscalar or array-like, optional, default: None
x coordinate(s) of the bars.
- colorscalar or array-like, optional
Colors of the bar faces.
- edgecolorscalar or array-like, optional
Colors of the bar edges.
- linewidthscalar or array-like, optional, default: None
Width of bar edge(s). If None, use default linewidth; If 0, don’t draw edges.
- xerrscalar or array-like, optional, default: None
If not None, will be used to generate errorbar(s) on the bar chart.
- yerrscalar or array-like, optional, default: None
If not None, will be used to generate errorbar(s) on the bar chart.
- ecolorscalar or array-like, optional, default: None
Specifies the color of errorbar(s)
- capsizeinteger, optional, default: 3
Determines the length in points of the error bar caps.
- error_kwdict
dictionary of kwargs to be passed to errorbar method. ecolor and capsize may be specified here rather than independent kwargs.
- align[‘edge’ | ‘center’], optional, default: ‘edge’
If edge, aligns bars by their left edges (for vertical bars) and by their bottom edges (for horizontal bars). If center, interpret the left argument as the coordinates of the centers of the bars.
- orientation‘vertical’ | ‘horizontal’, optional, default: ‘vertical’
The orientation of the bars.
- logboolean, optional, default: False
If true, sets the axis to be log scale.
- Returns
- bar_listlist of bar type objects
-
boxplot(self, x, notch=False, sym=None, vert=True, whis=1.5, positions=None, widths=None, patch_artist=False, bootstrap=None, usermedians=None, conf_intervals=None, meanline=False, showmeans=False, showcaps=True, showbox=True, showfliers=True, boxprops=None, labels=None, flierprops=None, medianprops=None, meanprops=None, capprops=None, whiskerprops=None, manage_xticks=True)[source]¶ Make a box and whisker plot.
Make a box and whisker plot for each column of x or each vector in sequence x. The box extends from the lower to upper quartile values of the data, with a line at the median. The whiskers extend from the box to show the range of the data. Flier points are those past the end of the whiskers.
- Parameters
- xArray or a sequence of vectors.
The input data.
- notchbool, default = False
If False, produces a rectangular box plot. If True, will produce a notched box plot
- symstr or None, default = None
The default symbol for flier points. Enter an empty string (‘’) if you don’t want to show fliers. If None, then the fliers default to ‘b+’ If you want more control use the flierprops kwarg.
- vertbool, default = True
If True (default), makes the boxes vertical. If False, makes horizontal boxes.
- whisfloat, sequence (default = 1.5) or string
As a float, determines the reach of the whiskers past the first and third quartiles (e.g., Q3 + whis*IQR, IQR = interquartile range, Q3-Q1). Beyond the whiskers, data are considered outliers and are plotted as individual points. Set this to an unreasonably high value to force the whiskers to show the min and max values. Alternatively, set this to an ascending sequence of percentile (e.g., [5, 95]) to set the whiskers at specific percentiles of the data. Finally, whis can be the string ‘range’ to force the whiskers to the min and max of the data. In the edge case that the 25th and 75th percentiles are equivalent, whis will be automatically set to ‘range’.
- bootstrapNone (default) or integer
Specifies whether to bootstrap the confidence intervals around the median for notched boxplots. If bootstrap==None, no bootstrapping is performed, and notches are calculated using a Gaussian-based asymptotic approximation (see McGill, R., Tukey, J.W., and Larsen, W.A., 1978, and Kendall and Stuart, 1967). Otherwise, bootstrap specifies the number of times to bootstrap the median to determine it’s 95% confidence intervals. Values between 1000 and 10000 are recommended.
- usermediansarray-like or None (default)
An array or sequence whose first dimension (or length) is compatible with x. This overrides the medians computed by matplotlib for each element of usermedians that is not None. When an element of usermedians == None, the median will be computed by matplotlib as normal.
- conf_intervalsarray-like or None (default)
Array or sequence whose first dimension (or length) is compatible with x and whose second dimension is 2. When the current element of conf_intervals is not None, the notch locations computed by matplotlib are overridden (assuming notch is True). When an element of conf_intervals is None, boxplot compute notches the method specified by the other kwargs (e.g., bootstrap).
- positionsarray-like, default = [1, 2, …, n]
Sets the positions of the boxes. The ticks and limits are automatically set to match the positions.
- widthsarray-like, default = 0.5
Either a scalar or a vector and sets the width of each box. The default is 0.5, or
0.15*(distance between extreme positions)if that is smaller.- labelssequence or None (default)
Labels for each dataset. Length must be compatible with dimensions of x
- patch_artistbool, default = False
If False produces boxes with the Line2D artist If True produces boxes with the Patch artist
- showmeansbool, default = False
If True, will toggle one the rendering of the means
- showcapsbool, default = True
If True, will toggle one the rendering of the caps
- showboxbool, default = True
If True, will toggle one the rendering of box
- showfliersbool, default = True
If True, will toggle one the rendering of the fliers
- boxpropsdict or None (default)
If provided, will set the plotting style of the boxes
- whiskerpropsdict or None (default)
If provided, will set the plotting style of the whiskers
- cappropsdict or None (default)
If provided, will set the plotting style of the caps
- flierpropsdict or None (default)
If provided, will set the plotting style of the fliers
- medianpropsdict or None (default)
If provided, will set the plotting style of the medians
- meanpropsdict or None (default)
If provided, will set the plotting style of the means
- meanlinebool, default = False
If True (and showmeans is True), will try to render the mean as a line spanning the full width of the box according to meanprops. Not recommended if shownotches is also True. Otherwise, means will be shown as points.
- Returns
- resultdict
A dictionary mapping each component of the boxplot to a list of the
matplotlib.lines.Line2Dinstances created. That dictionary has the following keys (assuming vertical boxplots):boxes: the main body of the boxplot showing the quartiles and the median’s confidence intervals if enabled.
medians: horizonal lines at the median of each box.
whiskers: the vertical lines extending to the most extreme, n-outlier data points.
caps: the horizontal lines at the ends of the whiskers.
fliers: points representing data that extend beyond the whiskers (outliers).
means: points or lines representing the means.
-
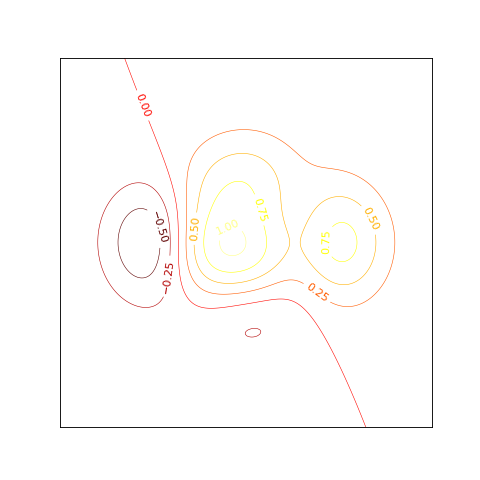
clabel(self, contour, *args, **kwargs)[source]¶ Label a contour plot.
- Parameters
- contourcontour object
returned from contour function
- fontsizeint
size in points or relative size e.g., ‘smaller’, ‘x-large’
- colorsstr
if None, the color of each label matches the color of the corresponding contour if one string color, e.g., colors = ‘r’ or colors = ‘red’, all labels will be plotted in this color if a tuple of matplotlib color args (string, float, rgb, etc), different labels will be plotted in different colors in the order specified
- inlinebool
controls whether the underlying contour is removed or not. Default is True.
- inline_spacingint
space in pixels to leave on each side of label when placing inline. Defaults to 5. This spacing will be exact for labels at locations where the contour is straight, less so for labels on curved contours.
- fmtstr
a format string for the label. Default is ‘%1.3f’ Alternatively, this can be a dictionary matching contour levels with arbitrary strings to use for each contour level (i.e., fmt[level]=string), or it can be any callable, such as a Formatter instance, that returns a string when called with a numeric contour level.
- manualbool
if True, contour labels will be placed manually using mouse clicks. Click the first button near a contour to add a label, click the second button (or potentially both mouse buttons at once) to finish adding labels. The third button can be used to remove the last label added, but only if labels are not inline. Alternatively, the keyboard can be used to select label locations (enter to end label placement, delete or backspace act like the third mouse button, and any other key will select a label location). manual can be an iterable object of x,y tuples. Contour labels will be created as if mouse is clicked at each x,y positions.
- rightside_upbool
if True (default), label rotations will always be plus or minus 90 degrees from level.
Examples
from secml.array import CArray
from secml.figure import CFigure


def f(x, y):
    return (1 - x / 2 + x ** 5 + y ** 3) * (-x ** 2 - y ** 2).exp()


fig = CFigure()

x_linspace = CArray.linspace(-3, 3, 256)
y_linspace = CArray.linspace(-3, 3, 256)

X, Y = CArray.meshgrid((x_linspace, y_linspace))

C = fig.sp.contour(X, Y, f(X, Y), linewidths=.5, cmap='hot')
fig.sp.clabel(C, inline=1, fontsize=10)

fig.sp.xticks(())
fig.sp.yticks(())

fig.show()
(Source code, png)
-
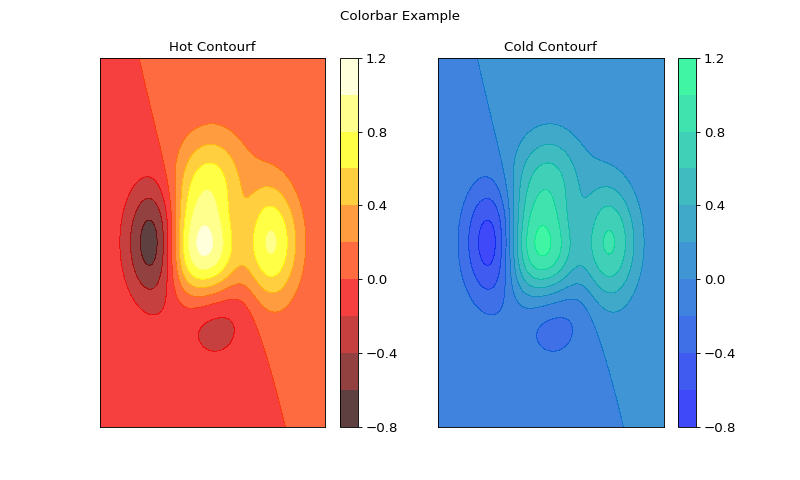
colorbar(self, mappable, ticks=None, *args, **kwargs)[source]¶ Add colorbar to plot.
- Parameters
- mappableobject
Image, ContourSet, or other to which the colorbar applies
- use_gridspecboolean, default False
if True colorbar is created as an instance of Subplot using the grid_spec module.
- Additional keyword arguments are of two kinds:
- Axes properties:
Property
Description
orientation
vertical or horizontal
fraction, default 0.15
fraction of original axes to use for colorbar
pad, default 0.05 if vertical, 0.15 if horizontal
fraction of original axes between colorbar and new image axes
shrink, default 1.0
fraction by which to shrink the colorbar
aspect, default 20
ratio of long to short dimensions
anchor, default (0.0, 0.5) if vertical; (0.5, 1.0) if horizontal
the anchor point of the colorbar axes
panchor, default (1.0, 0.5) if vertical; (0.5, 0.0) if horizontal;
the anchor point of the colorbar parent axes. If False, the parent axes’ anchor will be unchanged
- Colorbar properties:
Property
Description
extend
[ ‘neither’ | ‘both’ | ‘min’ | ‘max’ ] If not ‘neither’, make pointed end(s) for out-of- range values. These are set for a given colormap using the colormap set_under and set_over methods.
extendfrac
[ None | ‘auto’ | length | lengths ] If set to None, both the minimum and maximum triangular colorbar extensions with have a length of 5% of the interior colorbar length (this is the default setting). If set to ‘auto’, makes the triangular colorbar extensions the same lengths as the interior boxes (when spacing is set to ‘uniform’) or the same lengths as the respective adjacent interior boxes (when spacing is set to ‘proportional’). If a scalar, indicates the length of both the minimum and maximum triangular colorbar extensions as a fraction of the interior colorbar length. A two-element sequence of fractions may also be given, indicating the lengths of the minimum and maximum colorbar extensions respectively as a fraction of the interior colorbar length.
extendrect
[ False | True ] If False the minimum and maximum colorbar extensions will be triangular (the default). If True the extensions will be rectangular.
spacing
[ ‘uniform’ | ‘proportional’ ] Uniform spacing gives each discrete color the same space; proportional makes the space proportional to the data interval.
ticks
[ None | list of ticks | Locator object ] If None, ticks are determined automatically from the input.
format
[ None | format string | Formatter object ] If None, the ScalarFormatter is used. If a format string is given, e.g., ‘%.3f’, that is used. An alternative Formatter object may be given instead.
drawedges
[ False | True ] If true, draw lines at color boundaries.
Notes
If mappable is a ContourSet, its extend kwarg is included automatically. Note that the shrink kwarg provides a simple way to keep a vertical colorbar. If the colorbar is too tall (or a horizontal colorbar is too wide) use a smaller value of shrink.
Examples
from secml.array import CArray
from secml.figure import CFigure


def f(x, y):
    return (1 - x / 2 + x ** 5 + y ** 3) * (-x ** 2 - y ** 2).exp()

fig = CFigure(width=10, title="Colorbar Example")
fig.subplot(1, 2, 1)

x_linspace = CArray.linspace(-3, 3, 256)
y_linspace = CArray.linspace(-3, 3, 256)

X, Y = CArray.meshgrid((x_linspace, y_linspace))
c = fig.sp.contourf(X, Y, f(X, Y), 8, alpha=.75, cmap='hot')
fig.sp.colorbar(c)
fig.sp.title("Hot Contourf")
fig.sp.xticks(())
fig.sp.yticks(())

fig.subplot(1, 2, 2)
c = fig.sp.contourf(X, Y, f(X, Y), 8, alpha=.75, cmap='winter')
fig.sp.colorbar(c)
fig.sp.title("Cold Contourf")
fig.sp.xticks(())
fig.sp.yticks(())

fig.show()
(Source code, png)

-
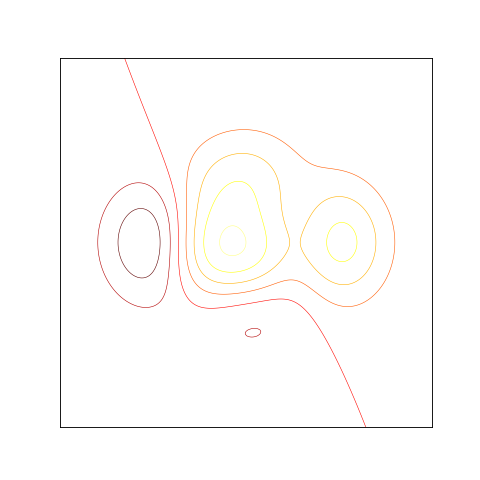
contour(self, x, y, z, *args, **kwargs)[source]¶ Draw contour lines of a function.
- Parameters
- x, yCArray or list
specify the (x, y) coordinates of the surface. X and Y must both be 2-D with the same shape as Z, or they must both be 1-D such that len(X) is the number of columns in Z and len(Y) is the number of rows in Z.
- zCArray or list
value into (x, y) surface’s position
- colors[ None | string | (mpl_colors) ]
If None, the colormap specified by cmap will be used. If a string, like ‘r’ or ‘red’, all levels will be plotted in this color. If a tuple of matplotlib color args (string, float, rgb, etc), different levels will be plotted in different colors in the order specified.
- alphafloat
The alpha blending value
- cmap[ None | Colormap ]
A cm Colormap instance or None. If cmap is None and colors is None, a default Colormap is used.
- vmin, vmax[ None | scalar ]
If not None, either or both of these values will be supplied to the matplotlib.colors. Normalize instance, overriding the default color scaling based on levels.
- levels[level0, level1, …, leveln]
A list of floating point numbers indicating the level curves to draw; e.g., to draw just the zero contour pass levels=[0]
- origin[ None | ‘upper’ | ‘lower’ | ‘image’ ]
If None, the first value of Z will correspond to the lower left corner, location (0,0). If ‘image’, the default parameter value for image.origin will be used. This keyword is not active if X and Y are specified in the call to contour.
- extent[ None | (x0,x1,y0,y1) ]
If origin is not None, then extent is interpreted as in matplotlib.pyplot.imshow(): it gives the outer pixel boundaries. In this case, the position of Z[0,0] is the center of the pixel, not a corner. If origin is None, then (x0, y0) is the position of Z[0,0], and (x1, y1) is the position of Z[-1,-1]. This keyword is not active if X and Y are specified in the call to contour.
- extend[ ‘neither’ | ‘both’ | ‘min’ | ‘max’ ]
Unless this is ‘neither’, contour levels are automatically added to one or both ends of the range so that all data are included. These added ranges are then mapped to the special colormap values which default to the ends of the colormap range.
- antialiased[ True | False ]
enable antialiasing, overriding the defaults. For filled contours, the default is True. For line contours, it is taken from default_parameters [‘lines.antialiased’].
- linewidths[ None | number | tuple of numbers ]
If linewidths is None, the default width in lines.linewidth default_parameters is used. If a number, all levels will be plotted with this linewidth. If a tuple, different levels will be plotted with different linewidths in the order specified.
- linestyles[ None | ‘solid’ | ‘dashed’ | ‘dashdot’ | ‘dotted’ ]
If linestyles is None, the default is ‘solid’ unless the lines are monochrome. In that case, negative contours will take their linestyle from the matplotlibrc contour.negative_ linestyle setting. linestyles can also be an iterable of the above strings specifying a set of linestyles to be used. If this iterable is shorter than the number of contour levels it will be repeated as necessary.
Examples
from secml.array import CArray
from secml.figure import CFigure


def f(x, y):
    return (1 - x / 2 + x ** 5 + y ** 3) * (-x ** 2 - y ** 2).exp()

fig = CFigure()

x_linspace = CArray.linspace(-3, 3, 256)
y_linspace = CArray.linspace(-3, 3, 256)

X, Y = CArray.meshgrid((x_linspace, y_linspace))

C = fig.sp.contour(X, Y, f(X, Y), linewidths=.5, cmap='hot')

fig.sp.xticks(())
fig.sp.yticks(())

fig.show()
(Source code, png)
-
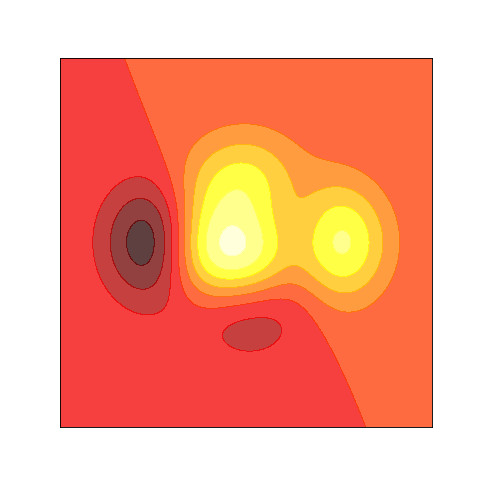
contourf(self, x, y, z, *args, **kwargs)[source]¶ Draw filled contour of a function.
- Parameters
- x, yCArray or list
specify the (x, y) coordinates of the surface. X and Y must both be 2-D with the same shape as Z, or they must both be 1-D such that len(X) is the number of columns in Z and len(Y) is the number of rows in Z.
- zCArray or list
value into (x, y) surface’s position
- colors[ None | string | (mpl_colors) ]
If None, the colormap specified by cmap will be used. If a string, like ‘r’ or ‘red’, all levels will be plotted in this color. If a tuple of matplotlib color args (string, float, rgb, etc), different levels will be plotted in different colors in the order specified.
- alphafloat
The alpha blending value
- cmap[ None | Colormap ]
A cm Colormap instance or None. If cmap is None and colors is None, a default Colormap is used.
- vmin, vmax[ None | scalar ]
If not None, either or both of these values will be supplied to the matplotlib.colors. Normalize instance, overriding the default color scaling based on levels.
- levels[level0, level1, …, leveln]
A list of floating point numbers indicating the level curves to draw; e.g., to draw just the zero contour pass levels=[0]
- origin[ None | ‘upper’ | ‘lower’ | ‘image’ ]
If None, the first value of Z will correspond to the lower left corner, location (0,0). If ‘image’, the default parameter value for image.origin will be used. This keyword is not active if X and Y are specified in the call to contour.
- extent[ None | (x0,x1,y0,y1) ]
If origin is not None, then extent is interpreted as in matplotlib.pyplot.imshow(): it gives the outer pixel boundaries. In this case, the position of Z[0,0] is the center of the pixel, not a corner. If origin is None, then (x0, y0) is the position of Z[0,0], and (x1, y1) is the position of Z[-1,-1]. This keyword is not active if X and Y are specified in the call to contour.
- extend[ ‘neither’ | ‘both’ | ‘min’ | ‘max’ ]
Unless this is ‘neither’, contour levels are automatically added to one or both ends of the range so that all data are included. These added ranges are then mapped to the special colormap values which default to the ends of the colormap range.
- antialiased[ True | False ]
enable antialiasing, overriding the defaults. For filled contours, the default is True. For line contours, it is taken from default_parameters [‘lines.antialiased’].
Examples
from secml.array import CArray
from secml.figure import CFigure


def f(x, y):
    return (1 - x / 2 + x ** 5 + y ** 3) * (-x ** 2 - y ** 2).exp()

fig = CFigure()

x_linspace = CArray.linspace(-3, 3, 256)
y_linspace = CArray.linspace(-3, 3, 256)

X, Y = CArray.meshgrid((x_linspace, y_linspace))
fig.sp.contourf(X, Y, f(X, Y), 8, alpha=.75, cmap='hot')

fig.sp.xticks(())
fig.sp.yticks(())

fig.show()
(Source code, png)
-
errorbar(self, x, y, xerr=None, yerr=None, *args, **kwargs)[source]¶ Plot with error deltas in yerr and xerr.
Vertical errorbars are plotted if yerr is not None. Horizontal errorbars are plotted if xerr is not None. x, y, xerr, and yerr can all be scalars, which plots a single error bar at x, y.
- Parameters
- xlist or CArray
x axis values.
- ylist or CArray
y axis values.
- xerr, yerr[ scalar | N, Nx1, or 2xN array-like ], default None
If a scalar number, len(N) array-like object, or an Nx1 array-like object, errorbars are drawn at +/-value relative to the data. If a sequence of shape 2xN, errorbars are drawn at -row1 and +row2 relative to the data.
- fmt[ ‘’ | ‘none’ | plot format string ], default ‘’
The plot format symbol. If fmt is ‘none’ (case-insensitive), only the errorbars are plotted. This is used for adding errorbars to a bar plot, for example. Default is ‘’, an empty plot format string; properties are then identical to the defaults for plot().
- ecolor[ None | mpl color ], default None
A matplotlib color arg which gives the color the errorbar lines; if None, use the color of the line connecting the markers.
- elinewidthscalar, default None
The linewidth of the errorbar lines. If None, use the linewidth.
- capsizescalar, default 3
The length of the error bar caps in points.
- capthickscalar, default None
An alias kwarg to markeredgewidth (a.k.a. - mew). This setting is a more sensible name for the property that controls the thickness of the error bar cap in points. For backwards compatibility, if mew or markeredgewidth are given, then they will over-ride capthick. This may change in future releases.
- barsabove[ True | False ]
if True, will plot the errorbars above the plot symbols. Default is below.
- lolims, uplims, xlolims, xuplims[ False | True ], default False
These arguments can be used to indicate that a value gives only upper/lower limits. In that case a caret symbol is used to indicate this. lims-arguments may be of the same type as xerr and yerr. To use limits with inverted axes, set_xlim() or set_ylim() must be called before errorbar().
- erroreverypositive integer, default 1
subsamples the errorbars. e.g., if everyerror=5, errorbars for every 5-th datapoint will be plotted. The data plot itself still shows all data points.
Examples
from secml.array import CArray
from secml.figure import CFigure

fig = CFigure(fontsize=16)
fig.title('Errorbars can go negative!')

fig.sp.xscale("symlog", nonposx='clip')
fig.sp.yscale("symlog", nonposy='clip')

x = CArray(10.0).pow(CArray.linspace(0.0, 2.0, 20))
y = x ** 2.0

fig.sp.errorbar(x, y, xerr=0.1 * x, yerr=5.0 + 0.75 * y)

fig.sp.ylim(bottom=0.1)

fig.sp.grid()
fig.show()
-
fill_between(self, x, y1, y2=0, where=None, interpolate=False, step=None, **kwargs)[source]¶ Fill the area between two horizontal curves.
The curves are defined by the points (x, y1) and (x, y2). This creates one or multiple polygons describing the filled area.
You may exclude some horizontal sections from filling using where.
By default, the edges connect the given points directly. Use step if the filling should be a step function, i.e. constant in between x.
- Parameters
- xCArray (length N)
The x coordinates of the nodes defining the curves.
- y1CArray (length N) or scalar
The y coordinates of the nodes defining the first curve.
- y2CArray (length N) or scalar, optional, default: 0
The y coordinates of the nodes defining the second curve.
- whereCArray of bool (length N), optional, default: None
Define where to exclude some horizontal regions from being filled. The filled regions are defined by the coordinates x[where]. More precisely, fill between x[i] and x[i+1] if where[i] and where[i+1]. Note that this definition implies that an isolated True value between two False values in where will not result in filling. Both sides of the True position remain unfilled due to the adjacent False values.
- interpolatebool, optional
This option is only relvant if where is used and the two curves are crossing each other. Semantically, where is often used for y1 > y2 or similar. By default, the nodes of the polygon defining the filled region will only be placed at the positions in the x array. Such a polygon cannot describe the above semantics close to the intersection. The x-sections containing the intersecion are simply clipped. Setting interpolate to True will calculate the actual intersection point and extend the filled region up to this point.
- step{‘pre’, ‘post’, ‘mid’}, optional
Define step if the filling should be a step function, i.e. constant in between x. The value determines where the step will occur:
‘pre’: The y value is continued constantly to the left from every x position, i.e. the interval (x[i-1], x[i]] has the value y[i].
‘post’: The y value is continued constantly to the right from every x position, i.e. the interval [x[i], x[i+1]) has the value y[i].
‘mid’: Steps occur half-way between the x positions.
-
get_legend_handles_labels(self)[source]¶ Return handles and labels for legend contained by the subplot.
-
get_params(self)[source]¶ Returns the dictionary of class hyperparameters.
A hyperparameter is a PUBLIC or READ/WRITE attribute.
-
get_state(self)[source]¶ Returns the object state dictionary.
- Returns
- dict
Dictionary containing the state of the object.
-
get_xticks_idx(self, xticks)[source]¶ Returns the position of markers to plot.
- Parameters
- xticksCArray
Ticks of x-axis where marker should be plotted.
- Returns
- ticks_idxlist
List with the position of each xtick.
Notes
If a given xtick is not exactly available, the closest value’s position will be returned.
-
grid(self, grid_on=True, axis='both', **kwargs)[source]¶ Draw grid for current plot.
- Parameters
- grid_onboolean, default True
if True show grid, elsewhere hide grid.
- axisstring, default ‘both’
can be ‘both’ (default), ‘x’, or ‘y’ to control which set of gridlines are drawn.
- kwargsany
Other keyword arguments for grid.
Examples
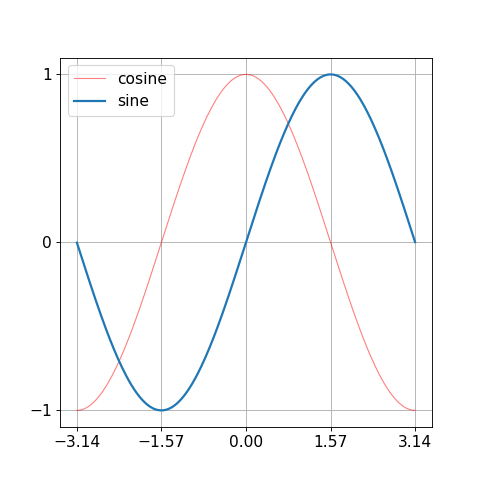
from secml.array import CArray
from secml.figure import CFigure

X = CArray.linspace(-3.14, 3.14, 256, endpoint=True)
C, S = X.cos(), X.sin()

fig = CFigure(fontsize=14)

fig.sp.plot(X, C, color='red', alpha=0.5, linewidth=1.0, linestyle='-', label="cosine")
fig.sp.plot(X, S, label="sine")

fig.sp.xticks(CArray([-3.14, -3.14 / 2, 0, 3.14 / 2, 3.14]))
fig.sp.yticks(CArray([-1, 0, +1]))
fig.sp.grid()
fig.sp.legend(loc=0)

fig.show()
(Source code, png)

-
hist(self, x, *args, **kwargs)[source]¶ Plot a histogram.
Compute and draw the histogram of x.
The return value is a tuple (n, bins, patches) or ([n0, n1, …], bins, [patches0, patches1,…]) if the input contains multiple data.
Multiple data can be provided via x as a list of datasets of potentially different length ([x0, x1, …]), or as a 2-D ndarray in which each column is a dataset.
- Parameters
- x(n,) array or sequence of (n,) arrays
Input values, this takes either a single array or a sequency of arrays which are not required to be of the same length
- binsinteger or array_like, optional, default is 10
If an integer is given, bins + 1 bin edges are returned. Unequally spaced bins are supported if bins is a sequence.
- rangetuple or None, optional
The lower and upper range of the bins. Lower and upper outliers are ignored. If not provided, range is (x.min(), x.max()). Range has no effect if bins is a sequence. If bins is a sequence or range is specified, autoscaling is based on the specified bin range instead of the range of x.
- densityboolean, optional
If True, the first element of the return tuple will be the counts normalized to form a probability density, i.e., n/(len(x)`dbin), i.e., the integral of the histogram will sum to 1. If stacked is also True, the sum of the histograms is normalized to 1.
- weights(n, ) array_like or None, optional
An array of weights, of the same shape as x. Each value in x only contributes its associated weight towards the bin count (instead of 1). If density is True, the weights are normalized, so that the integral of the density over the range remains 1.
- cumulativeboolean, optional
Dafault False. If True, then a histogram is computed where each bin gives the counts in that bin plus all bins for smaller values. The last bin gives the total number of datapoints. If density is also True then the histogram is normalized such that the last bin equals 1. If cumulative evaluates to less than 0 (e.g., -1), the direction of accumulation is reversed. In this case, if density is also True, then the histogram is normalized such that the first bin equals 1.
- bottomarray_like, scalar, or None
Location of the bottom baseline of each bin. If a scalar, the base line for each bin is shifted by the same amount. If an array, each bin is shifted independently and the length of bottom must match the number of bins. If None, defaults to 0.
- histtype{‘bar’, ‘barstacked’, ‘step’, ‘stepfilled’}, optional
‘bar’ (default) is a traditional bar-type histogram. If multiple data are given the bars are aranged side by side.
‘barstacked’ is a bar-type histogram where multiple data are stacked on top of each other.
‘step’ generates a lineplot that is by default unfilled.
‘stepfilled’ generates a lineplot that is by default filled.
- align{‘left’, ‘mid’, ‘right’}, optional
‘left’: bars are centered on the left bin edges.
‘mid’: default, bars are centered between the bin edges.
‘right’: bars are centered on the right bin edges.
- orientation{‘horizontal’, ‘vertical’}, optional
If ‘horizontal’, barh will be used for bar-type histograms and the bottom kwarg will be the left edges.
- rwidthscalar or None, optional
The relative width of the bars as a fraction of the bin width. If None, automatically compute the width. Ignored if histtype is ‘step’ or ‘stepfilled’.
- logboolean, optional
Default False. If True, the histogram axis will be set to a log scale. If log is True and x is a 1D array, empty bins will be filtered out and only the non-empty (n, bins, patches) will be returned.
- colorcolor or array_like of colors or None, optional
Color spec or sequence of color specs, one per dataset. Default (None) uses the standard line color sequence.
- labelstring or None, optional
String, or sequence of strings to match multiple datasets. Bar charts yield multiple patches per dataset, but only the first gets the label, so that the legend command will work as expected.
- stackedboolean, optional
If True, multiple data are stacked on top of each other. If False (default) multiple data are aranged side by side if histtype is ‘bar’ or on top of each other if histtype is ‘step’.
- Returns
- nCArray or list of arrays
The values of the histogram bins. See density and weights for a description of the possible semantics. If input x is an array, then this is an array of length nbins. If input is a sequence arrays [data1, data2,..], then this is a list of arrays with the values of the histograms for each of the arrays in the same order.
- binsCArray
The edges of the bins. Length nbins + 1 (nbins left edges and right edge of last bin). Always a single array even when multiple data sets are passed in.
- patcheslist or list of lists
Silent list of individual patches used to create the histogram or list of such list if multiple input datasets.
Examples
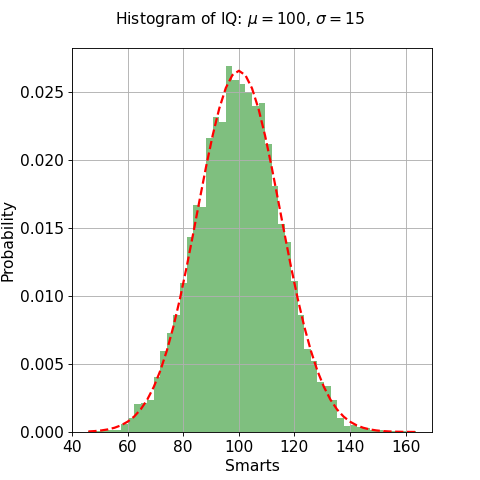
from secml.array import CArray
from secml.figure import CFigure

fig = CFigure(fontsize=14)

# example data
mu = 100  # mean of distribution
sigma = 15  # standard deviation of distribution
x = mu + sigma * CArray.randn((10000,))
num_bins = 50
# the histogram of the data
n, bins, patches = fig.sp.hist(x, num_bins, density=1, facecolor='green', alpha=0.5)
# add a 'best fit' line
y = bins.normpdf(mu, sigma)
fig.sp.plot(bins, y, 'r--')
fig.sp.xlabel('Smarts')
fig.sp.ylabel('Probability')
fig.title(r'Histogram of IQ: $\mu=100$, $\sigma=15$')

# Tweak spacing to prevent clipping of ylabel
fig.subplots_adjust(left=0.15)

fig.sp.grid()
fig.show()
(Source code, png)

-
imshow(self, img, *args, **kwargs)[source]¶ Plot image.
- Parameters
- imgCArray or PIL.Image.Image
Image to plot.
-
legend(self, *args, **kwargs)[source]¶ Create legend for plot.
- Parameters
- loc: integer or string or pair of floats, default: 0
Integer
Location
0
‘best’
1
‘upper right’
2
‘upper left’
3
‘lower left’
4
‘lower right’
5
‘right’
6
‘center left’
7
‘center right’
8
‘lower center’
9
‘upper center’
10
‘center’
- bbox_to_anchortuple of floats
Specify any arbitrary location for the legend in bbox_transform coordinates (default Axes coordinates). For example, to put the legend’s upper right hand corner in the center of the axes the following keywords can be used: loc=’upper right’, bbox_to_anchor=(0.5, 0.5).
- ncolinteger
The number of columns that the legend has. Default is 1.
- propNone or dict
The font properties of the legend. If None (default), the current default parameters will be used.
- fontsizeint or float or {‘xx-small’, ‘x-small’, ‘small’, ‘medium’, ‘large’, ‘x-large’, ‘xx-large’}
Controls the font size of the legend. If the value is numeric the size will be the absolute font size in points. String values are relative to the current default font size. This argument is only used if prop is not specified.
- numpointsNone or int
The number of marker points in the legend when creating a legend entry for a line. Default is None which will take the value from the legend.numpoints default parameter.
- scatterpointsNone or int
The number of marker points in the legend when creating a legend entry for a scatter plot. Default is None which will take the value from the legend.scatterpoints default parameter.
- scatteryoffsetsiterable of floats
The vertical offset (relative to the font size) for the markers created for a scatter plot legend entry. 0.0 is at the base the legend text, and 1.0 is at the top. To draw all markers at the same height, set to [0.5]. Default [0.375, 0.5, 0.3125].
- markerscaleNone or int or float
The relative size of legend markers compared with the originally drawn ones. Default is None which will take the value from the legend.markerscale default parameter.
- frameonNone or bool
Control whether a frame should be drawn around the legend. Default is None which will take the value from the legend.frameon default parameter.
- fancyboxNone or bool
Control whether round edges should be enabled around the FancyBboxPatch which makes up the legend’s background. Default is None which will take the value from the legend.fancybox default parameter.
- shadowNone or bool
Control whether to draw a shadow behind the legend. Default is None which will take the value from the legend.shadow default parameter.
- framealphaNone or float
Control the alpha transparency of the legend’s frame. Default is None which will take the value from the legend.framealpha default parameter.
- modeeither between {“expand”, None}
If mode is set to “expand” the legend will be horizontally expanded to fill the axes area (or bbox_to_anchor if defines the legend’s size).
- bbox_transformNone or matplotlib.transforms.Transform
The transform for the bounding box (bbox_to_anchor). For a value of None (default) the Axes’ transAxes transform will be used.
- titlestr or None
The legend’s title. Default is no title (None).
- borderpadfloat or None
The fractional whitespace inside the legend border. Measured in font-size units. Default is None which will take the value from the legend.borderpad default parameter.
- labelspacingfloat or None
The vertical space between the legend entries. Measured in font-size units. Default is None which will take the value from the legend.labelspacing default parameter.
- handlelengthfloat or None
The length of the legend handles. Measured in font-size units. Default is None which will take the value from the legend.handlelength default parameter.
- handletextpadfloat or None
The pad between the legend handle and text. Measured in font-size units. Default is None which will take the value from the legend.handletextpad default parameter.
- borderaxespadfloat or None
The pad between the axes and legend border. Measured in font-size units. Default is None which will take the value from the legend.borderaxespad default parameter.
- columnspacingfloat or None
The spacing between columns. Measured in font-size units. Default is None which will take the value from the legend.columnspacing default parameter.
- *args, **kwargs
Same as
text.
Examples
from secml.array import CArray
from secml.figure import CFigure

X = CArray.linspace(-3.14, 3.14, 256, endpoint=True)
C, S = X.cos(), X.sin()

fig = CFigure(fontsize=14)
fig.sp.plot(X, C, color='red', alpha=0.5, linewidth=1.0, linestyle='-', label="cosine")
fig.sp.plot(X, S, label="sine")

fig.sp.grid()
fig.sp.legend(loc=0)

fig.show()
(Source code, png)

-
load_state(self, path)[source]¶ Sets the object state from file.
- Parameters
- pathstr
The full path of the file from which to load the object state.
See also
set_stateSets the object state using input dictionary.
-
loglog(self, x, y=None, *args, **kwargs)[source]¶ Plot with log scaling on both the x and y axis.
If only one array is given it is supposed to be the y axis data. x axis values are set as index array 0..N-1 .
- Parameters
- xlist or CArray
x axis values.
- ylist or CArray
y axis values.
- basex, baseyscalar > 1, default is 10
Base of the x/y logarithm.
- subsx, subsy[ None | sequence ]
Where to place the subticks between each major tick. Should be a sequence of integers. For example, in a log10 scale: [2, 3, 4, 5, 6, 7, 8, 9] will place 8 logarithmically spaced minor ticks between each major tick.
- nonposx, nonposy[‘mask’ | ‘clip’ ], default ‘mask’.
Non-positive values in x or y can be masked as invalid, or clipped to a very small positive number.
See also
plotPlot with standard axis.
-
matshow(self, array, *args, **kwargs)[source]¶ Plot an array as a matrix.
- Parameters
- arrayCArray
Array that we want plot as a matrix.
-
merge(self, sp)[source]¶ Merge input subplot to active subplot.
- Parameters
- spCPlot
Subplot to be merged.
-
property
n_lines¶ Returns the number of lines inside current subplot.
-
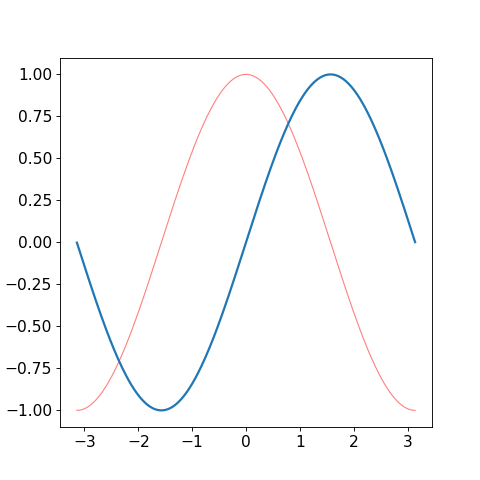
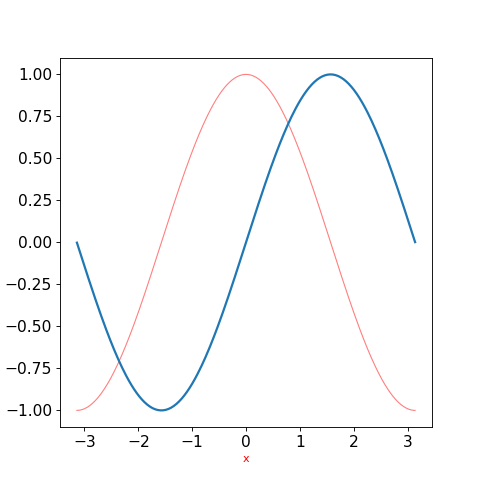
plot(self, x, y=None, *args, **kwargs)[source]¶ Plot a line.
If only one array is given it is supposed to be the y axis data. x axis values are set as index array 0..N-1 .
- Parameters
- xlist or CArray
x axis values
- ylist or CArray
y axis values
- colorstr
Character
Color
‘b’
blue
‘g’
green
‘r’
red
‘c’
cyan
‘m’
magenta
‘y’
yellow
‘k’
black
‘w’
white
- alphafloat, default 1.0
0.0 for transparent through 1.0 opaque
- linestylecharacter, default ‘-’
Can be one into this list : [‘-’ | ‘–’ | ‘-.’ | ‘:’ | ‘None’ | ‘ ‘ | ‘’]
- linewidthfloat
0.0 to 1.0
- markerstr
Character
Marker
‘.’
point marker
‘,’
pixel marker
‘o’
circle marker
‘v’
triangle_down marker
‘^’
triangle_up marker
‘<’
triangle_left marker
‘>’
triangle_right marker
‘1’
tri_down marker
‘2’
tri_up marker
‘3’
tri_left marker
‘4’
tri_right marker
‘s’
square marker
‘p’
pentagon marker
‘*’
star marker
‘h’
hexagon1 marker
‘H’
hexagon2 marker
‘+’
plus marker
‘x’
x marker
‘D’
diamond marker
‘d’
thin_diamond marker
‘|’
vline marker
‘_’
hline marker
Examples
from secml.array import CArray
from secml.figure import CFigure

X = CArray.linspace(-3.14, 3.14, 256, endpoint=True)
C, S = X.cos(), X.sin()

fig = CFigure(fontsize=14)

fig.sp.plot(X, C, color='red', alpha=0.5, linewidth=1.0, linestyle='-')
fig.sp.plot(X, S)

fig.show()
(Source code, png)
-
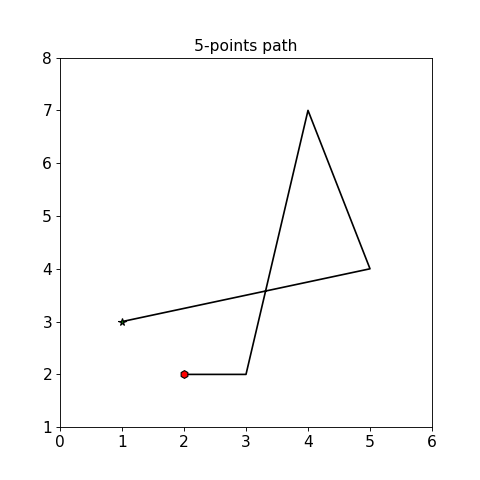
plot_path(self, path, path_style='-', path_width=1.5, path_color='k', straight=False, start_style='h', start_facecolor='r', start_edgecolor='k', start_edgewidth=1, final_style='*', final_facecolor='g', final_edgecolor='k', final_edgewidth=1)[source]¶ Plot a path traversed by a point.
By default, path is drawn in solid black, start point is drawn with a red star and the end point is drawn with a green asterisk.
- Parameters
- pathCArray
Every row contain one point coordinate.
- path_stylestr
Style for the path line. Default solid (-).
- path_widthint
Width of path line. Default 1.5.
- path_colorstr
Color for the path line. Default black (k).
- straightbool, default False
If True, path will be plotted straight between start and end point.
- start_stylestr
Style for the start point. Default an hexagon (h).
- start_facecolorstr
Color for the start point. Default red (r).
- start_edgecolorstr
Color for the edge of the start point marker. Default black (k).
- start_edgewidthscalar
Width of the edge for the start point. Default 1.
- final_stylestr
Style for the end point. Default a star (*).
- final_facecolorstr
Color for the end point. Default red (g).
- final_edgecolorstr
Color for the edge of the final point marker. Default black (k).
- final_edgewidthscalar
Width of the edge for the end point. Default 1.
Examples
from secml.array import CArray
from secml.figure import CFigure

fig = CFigure(fontsize=14)
fig.sp.title("5-points path")

path = CArray([[2, 2], [3, 2], [4, 7], [5, 4], [1, 3]])

fig.sp.plot_path(path)

fig.sp.xlim(0, 6)
fig.sp.ylim(1, 8)

fig.show()
(Source code, png)
-
quiver(self, U, V, X=None, Y=None, color='k', linestyle='-', linewidth=1.0, alpha=1.0)[source]¶ A quiver plot displays velocity vectors as arrows with components (u,v) at the points (x,y).
For example, the first vector is defined by components u(1), v(1) and is displayed at the point x(1), y(1).
quiver(x,y,u,v) plots vectors as arrows at the coordinates specified in each corresponding pair of elements in x and y.
quiver(u,v) draws vectors specified by u and v at equally spaced points in the x-y plane.
- Parameters
- U, V: scalar or CArray
Give the x and y components of the arrow vectors.
- X, Y: scalar or CArray, optional
The x and y coordinates of the arrow locations (default is tail of arrow; see pivot kwarg)
- color :
Color of the gradient directions.
- linestylestr
[‘solid’ | ‘dashed’, ‘dashdot’, ‘dotted’ | (offset, on-off-dash-seq) | ‘-’ | ‘–’ | ‘-.’ | ‘:’ | ‘None’ | ‘ ‘ | ‘’]
- linewidthfloat
Width of the line.
- alphafloat
Transparency factor of the directions.
-
save_state(self, path)[source]¶ Store the object state to file.
- Parameters
- pathstr
Path of the file where to store object state.
- Returns
- str
The full path of the stored object.
See also
get_stateReturns the object state dictionary.
-
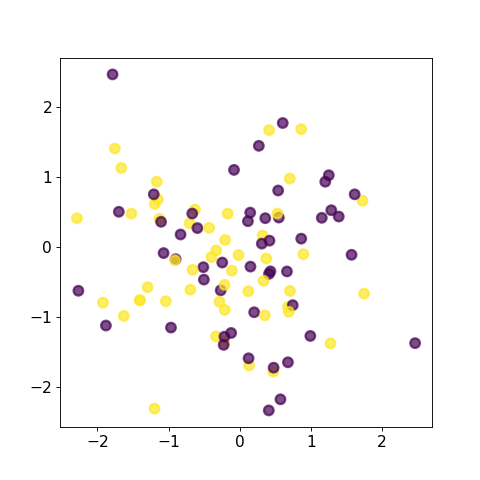
scatter(self, x, y, s=20, c='b', *args, **kwargs)[source]¶ Scatter plot of x vs y.
- Parameters
- x, ylist or CArray
Input data. Both object must have the same size.
- sscalar or shape (n, ), optional, default: 20
size in points^2.
- ccolor or sequence of color, optional, default ‘b’
c can be a single color format string, or a sequence of color specifications of length N, or a sequence of numbers with the same shape of x,y to be mapped to colors using the cmap and norm specified via kwargs (see below). Note that c should not be a single numeric RGB or RGBA sequence because that is indistinguishable from an array of values to be colormapped. c can be a 2-D array in which the rows are RGB or RGBA, however.
- markerMarkerStyle, optional, default: ‘o’
See markers for more information on the different styles of markers scatter supports.
- cmapColormap, optional, default: None
A Colormap instance or registered name. cmap is only used if c is an array of floats. If None, default parameter image.cmap is used.
- normNormalize, optional, default: None
A Normalize instance is used to scale luminance data to 0, 1. norm is only used if c is an array of floats.
- vmin, vmaxscalar, optional, default: None
vmin and vmax are used in conjunction with norm to normalize luminance data. If either are None, the min and max of the color array is used. Note if you pass a norm instance, your settings for vmin and vmax will be ignored.
- alphascalar, optional, default: None
The alpha blending value, between 0 (transparent) and 1 (opaque)
- linewidthsscalar or array_like, optional, default: None
If None, defaults to (lines.linewidth,). Note that this is a tuple, and if you set the linewidths argument you must set it as a sequence of float.
Examples
from secml.data.loader import CDLRandom
from secml.figure import CFigure

dataset = CDLRandom().load()

fig = CFigure(fontsize=14)
fig.sp.scatter(dataset.X[:, 0].ravel(),
               dataset.X[:, 1].ravel(),
               s=75, c=dataset.Y, alpha=.7)

fig.show()
(Source code, png)
-
semilogx(self, x, y=None, *args, **kwargs)[source]¶ Plot with log scaling on the x axis.
If only one array is given it is supposed to be the y axis data. x axis values are set as index array 0..N-1 .
- Parameters
- xlist or CArray
x axis values
- ylist or CArray
y axis values
- basexscalar > 1, default is 10
Base of the x logarithm
- subsx[ None | sequence ]
Where to place the subticks between each major tick. Sequence of integers. For example, in a log10 scale: [2, 3, 4, 5, 6, 7, 8, 9] will place 8 logarithmically spaced minor ticks between each major tick.
- nonposx[ ‘mask’ | ‘clip’ ], default ‘mask’
Non-positive values in x can be masked as invalid, or clipped to a very small positive number
See also
plotPlot with standard axis.
Examples
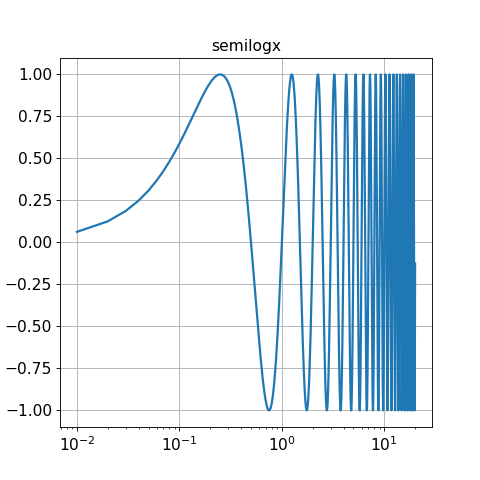
from secml.array import CArray
from secml.figure import CFigure

fig = CFigure(fontsize=14)

t = CArray.arange(0.01, 20.0, 0.01)
fig.sp.semilogx(t, (2 * 3.14 * t).sin())

fig.sp.grid()
fig.sp.title('semilogx')

fig.show()
(Source code, png)

-
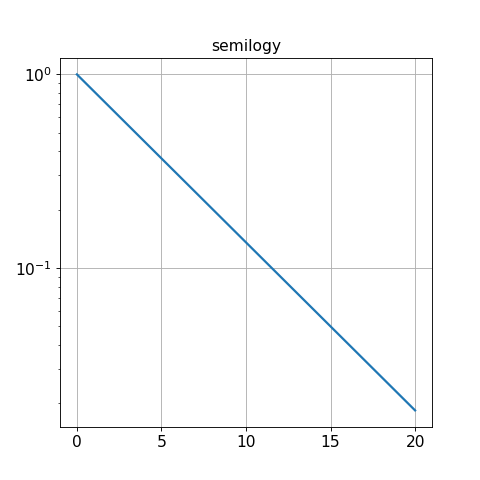
semilogy(self, x, y=None, *args, **kwargs)[source]¶ Plot with log scaling on the y axis.
If only one array is given it is supposed to be the y axis data. x axis values are set as index array 0..N-1 .
- Parameters
- xlist or CArray
x axis values.
- ylist or CArray
y axis values.
- baseyscalar > 1, default is 10
Base of the y logarithm
- subsy[ None | sequence ], default None
Where to place the subticks between each major tick. Should be a sequence of integers. For example, in a log10 scale: [2, 3, 4, 5, 6, 7, 8, 9] will place 8 logarithmically spaced minor ticks between each major tick.
- nonposy[ ‘mask’ | ‘clip’ ], default ‘mask’
Non-positive values in x can be masked as invalid, or clipped to a very small positive number.
See also
plotPlot with standard axis.
Examples
from secml.array import CArray
from secml.figure import CFigure

fig = CFigure(fontsize=14)

t = CArray.arange(0.01, 20.0, 0.01)
fig.sp.semilogy(t, (-t / 5.0).exp())

fig.sp.title('semilogy')
fig.sp.grid()
fig.show()
(Source code, png)

-
set(self, param_name, param_value, copy=False)[source]¶ Set a parameter of the class.
Only writable attributes of the class, i.e. PUBLIC or READ/WRITE, can be set.
- The following checks are performed before setting:
if param_name is an attribute of current class, set directly;
- else, iterate over __dict__ and look for a class attribute
having the desired parameter as an attribute;
- else, if attribute is not found on the 2nd level,
raise AttributeError.
If possible, a reference to the attribute to set is assigned. Use copy=True to always make a deepcopy before set.
- Parameters
- param_namestr
Name of the parameter to set.
- param_valueany
Value to set for the parameter.
- copybool
By default (False) a reference to the parameter to assign is set. If True or a reference cannot be extracted, a deepcopy of the parameter value is done first.
-
set_state(self, state_dict, copy=False)[source]¶ Sets the object state using input dictionary.
Only readable attributes of the class, i.e. PUBLIC or READ/WRITE or READ ONLY, can be set.
If possible, a reference to the attribute to set is assigned. Use copy=True to always make a deepcopy before set.
- Parameters
- state_dictdict
Dictionary containing the state of the object.
- copybool, optional
By default (False) a reference to the attribute to assign is set. If True or a reference cannot be extracted, a deepcopy of the attribute is done first.
-
text(self, *args, **kwargs)[source]¶ Create a Text instance at x, y with string text.
- Parameters
- Any of the following keyword arguments is supported.
- Text properties:
Property
Description
alpha
float (0.0 transparent through 1.0 opaque)
animated
[True | False]
backgroundcolor
one of possible color
bbox
rectangle prop dict
color
one of possible color
family or fontfamily or fontname or name
[FONTNAME | ‘serif’ | ‘sans-serif’ | ‘cursive’ | ‘fantasy’ | ‘monospace’ ]
horizontalalignment or ha
[ ‘center’ | ‘right’ | ‘left’ ]
label
string or anything printable with ‘%s’ conversion.
linespacing
float (multiple of font size)
position
(x,y)
rasterized
[True | False | None]
rotation
[ angle in degrees | ‘vertical’ | ‘horizontal’ ]
size or fontsize
[size in points | ‘xx-small’ | ‘x-small’ | ‘small’ | ‘medium’ | ‘large’ | ‘x-large’ | ‘xx-large’ ]
stretch or fontstretch
[a numeric value in range 0-1000 | ‘ultra-condensed’ | ‘extra-condensed’ | ‘condensed’ | ‘semi-condensed’ | ‘normal’ | ‘semi-expanded’ | ‘expanded’ | ‘extra-expanded’ | ‘ultra-expanded’ ]
style or fontstyle
[ ‘normal’ | ‘italic’ | ‘oblique’]
text
string or anything printable with ‘%s’ conversion.
verticalalignment or va or ma
[ ‘center’ | ‘top’ | ‘bottom’ | ‘baseline’ ]
visible
[True | False]
weight or fontweight
[a numeric value in range 0-1000 | ‘ultralight’ | ‘light’ | ‘normal’ | ‘regular’ | ‘book’ | ‘medium’ | ‘roman’ | ‘semibold’ | ‘demibold’ | ‘demi’ | ‘bold’ | ‘heavy’ | ‘extra bold’ | ‘black’ ]
x
float, x position of the text.
y
float. y position of the text.
zorder
any number, objects with lower zorder values are drawn first.
- Font properties:
Property
Description
family
(font name or font family) es: ‘serif’, ‘sans-serif’, ‘cursive’, ‘fantasy’, or ‘monospace’
style
either between ‘normal’, ‘italic’ or ‘oblique’
variant
‘normal’ or ‘small-caps’
stretch
A numeric value in the range 0-1000 or one of ‘ultra-condensed’, ‘extra-condensed’, ‘condensed’, ‘semi-condensed’, ‘normal’, ‘semi-expanded’, ‘expanded’, ‘extra-expanded’ or ‘ultra-expanded’
weight
A numeric value in the range 0-1000 or one of ‘ultralight’, ‘light’, ‘normal’, ‘regular’, ‘book’, ‘medium’, ‘roman’, ‘semibold’, ‘demibold’, ‘demi’, ‘bold’, ‘heavy’, ‘extra bold’, ‘black’
size
Either an relative value of ‘xx-small’, ‘x-small’, ‘small’, ‘medium’, ‘large’, ‘x-large’, ‘xx-large’ or an absolute font size, e.g., 12
-
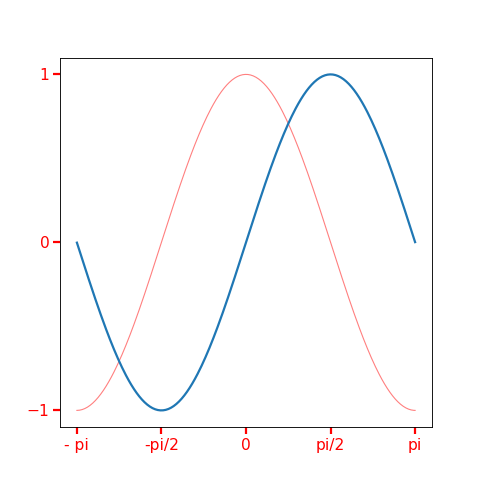
tick_params(self, *args, **kwargs)[source]¶ Change the appearance of ticks and tick labels.
- Parameters
- axis[‘x’ | ‘y’ | ‘both’]
Axis on which to operate; default is ‘both’.
- reset[True | False]
Default False. If True, set all parameters to defaults before processing other keyword arguments.
- which[‘major’ | ‘minor’ | ‘both’]
Default is ‘major’; apply arguments to which ticks.
- direction[‘in’ | ‘out’ | ‘inout’]
Puts ticks inside the axes, outside the axes, or both.
- lengthint
Tick length in points.
- widthint
Tick width in points.
- colorstr
Tick color; accepts any mpl color spec.
- padint
Distance in points between tick and label.
- labelsizeint, str
Tick label font size in points or as a string (e.g., ‘large’).
- labelcolorstr
Tick label color; mpl color spec.
- colorsstr
Changes the tick color and the label color to the same value: mpl color spec.
- bottom, top, left, rightbool, optional
Controls whether to draw the respective ticks.
- labelbottom, labeltop, labelleft, labelrightbool, optional
Controls whether to draw the respective tick labels.
Examples
from secml.array import CArray
from secml.figure import CFigure
from secml.core.constants import pi

X = CArray.linspace(-3.14, 3.14, 256, endpoint=True)
C, S = X.cos(), X.sin()

fig = CFigure(fontsize=14)

fig.sp.plot(X, C, color='red', alpha=0.5, linewidth=1.0, linestyle='-')
fig.sp.plot(X, S)

fig.sp.xticks(CArray([-pi, -pi / 2, 0, pi / 2, pi]))
fig.sp.xticklabels(CArray(["- pi", "-pi/2", "0", "pi/2", "pi"]))
fig.sp.tick_params(direction='out', length=6, width=2, colors='r', right=False)
fig.sp.yticks(CArray([-1, 0, +1]))

fig.show()
(Source code, png)

-
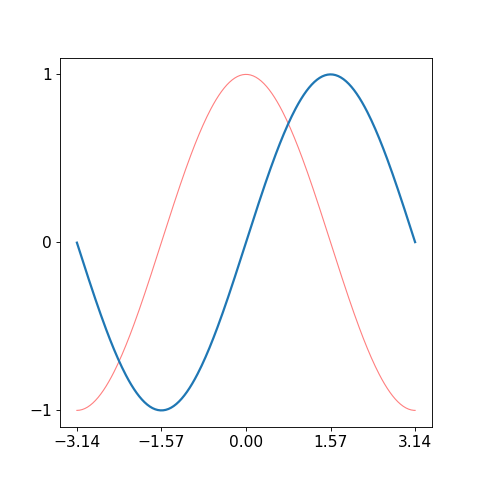
xlabel(self, label, *args, **kwargs)[source]¶ Set a label for the x axis.
- Parameters
- labelstring
Label’s text.
- *args, **kwargs
Same as
textmethod.
Examples
from secml.array import CArray
from secml.figure import CFigure

X = CArray.linspace(-3.14, 3.14, 256, endpoint=True)
C, S = X.cos(), X.sin()

fig = CFigure(fontsize=14)

fig.sp.plot(X, C, color='red', alpha=0.5, linewidth=1.0, linestyle='-')
fig.sp.plot(X, S)

fig.sp.xlabel("x", color='r', fontsize=10)

fig.show()
(Source code, png)
-
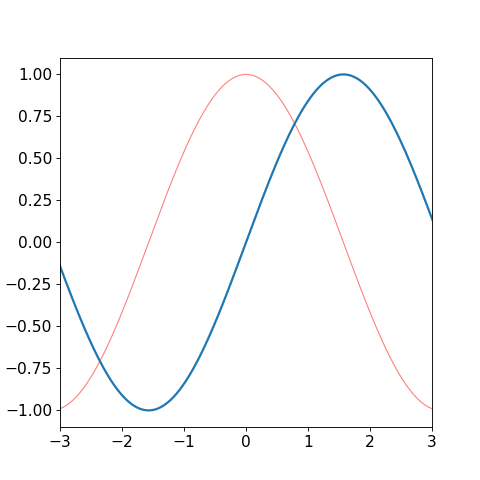
xlim(self, bottom=None, top=None)[source]¶ Set axes x limits.
- Parameters
- bottomscalar
Starting value for the x axis.
- topscalar
Ending value for the x axis.
Examples
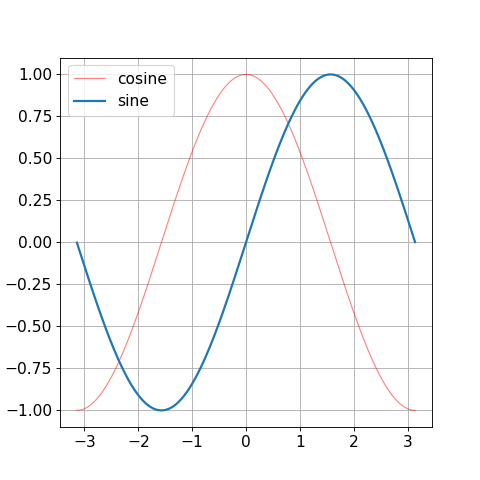
from secml.array import CArray
from secml.figure import CFigure

X = CArray.linspace(-3.14, 3.14, 256, endpoint=True)
C, S = X.cos(), X.sin()

fig = CFigure(fontsize=14)

fig.sp.plot(X, C, color='red', alpha=0.5, linewidth=1.0, linestyle='-')
fig.sp.plot(X, S)

fig.sp.xlim(-3, 3)

fig.show()
(Source code, png)

-
xscale(self, scale_type, nonposx='mask', basex=10, **kwargs)[source]¶ Set scale for x axis.
- Parameters
- scale_type{‘linear’, ‘log’, ‘symlog’, ‘logit’}
Scale for x axis. Default ‘linear’.
- nonposx: [ ‘mask’ | ‘clip’ ], default ‘mask’
Non-positive values in x can be masked as invalid, or clipped to a very small positive number.
- basexint
The base of the logarithm, must be higger than 1.
-
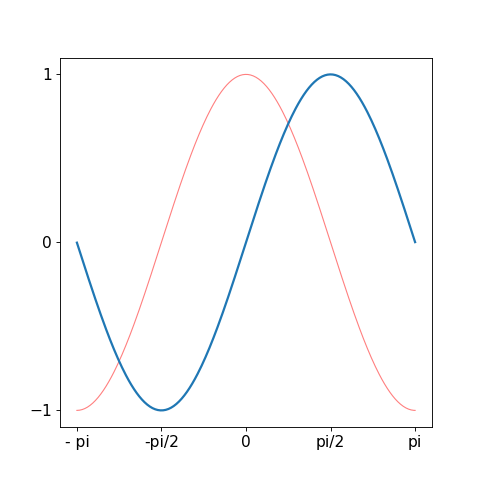
xticklabels(self, labels, *args, **kwargs)[source]¶ Set the xtick labels.
- Parameters
- labelslist or CArray of string
Xtick labels.
- *args, **kwargs
Same as
textmethod.
Examples
from secml.array import CArray
from secml.figure import CFigure

X = CArray.linspace(-3.14, 3.14, 256, endpoint=True)
C, S = X.cos(), X.sin()

fig = CFigure(fontsize=14)

fig.sp.plot(X, C, color='red', alpha=0.5, linewidth=1.0, linestyle='-')
fig.sp.plot(X, S)

fig.sp.xticks(CArray([-3.14, -3.14 / 2, 0, 3.14 / 2, 3.14]))
fig.sp.xticklabels(["- pi", "-pi/2", "0", "pi/2", "pi"])

fig.sp.yticks(CArray([-1, 0, +1]))

fig.show()
(Source code, png)

-
xticks(self, location_array, *args, **kwargs)[source]¶ Set the x-tick locations and labels.
- Parameters
- location_arrayCArray or list
Contain ticks location.
- *args, **kwargs
Same as
textmethod.
Examples
from secml.array import CArray
from secml.figure import CFigure

X = CArray.linspace(-3.14, 3.14, 256, endpoint=True)
C, S = X.cos(), X.sin()

fig = CFigure(fontsize=14)

fig.sp.plot(X, C, color='red', alpha=0.5, linewidth=1.0, linestyle='-')
fig.sp.plot(X, S)

fig.sp.xticks(CArray([-3.14, -3.14 / 2, 0, 3.14 / 2, 3.14]))
fig.sp.yticks(CArray([-1, 0, +1]))

fig.show()
(Source code, png)
-
ylabel(self, label, *args, **kwargs)[source]¶ Set a label for the y axis
- Parameters
- labelstring
Label’s text.
- *args, **kwargs
Same as
textmethod.
See also
xlabelSet a label for the x axis.
-
ylim(self, bottom=None, top=None)[source]¶ Set axes y limits.
- Parameters
- bottomscalar
Starting value for the y axis.
- topscalar
Ending value for the y axis.
See also
xlimSet x axis limits.
-
yscale(self, scale_type, nonposy='mask', basey=10, **kwargs)[source]¶ Set scale for y axis.
- Parameters
- scale_type{‘linear’, ‘log’, ‘symlog’, ‘logit’}
Scale for y axis. Default ‘linear’.
- nonposy: [ ‘mask’ | ‘clip’ ], default ‘mask’
Non-positive values in y can be masked as invalid, or clipped to a very small positive number.
- baseyint
The base of the logarithm, must be higger than 1.
-
yticklabels(self, labels, *args, **kwargs)[source]¶ Set the ytick labels.
- Parameters
- labelslist or CArray of string
Xtick labels.
- *args, **kwargs
Same as
textmethod.
See also
xticklabelsSet the xtick labels.
-
class
secml.figure._plots.c_plot_classifier.CPlotClassifier(sp, default_params)[source]¶ Plot a classifier.
Custom plotting parameters can be specified.
- Currently parameters default:
grid: False.
- Attributes
class_typeDefines class type.
loggerLogger for current object.
n_linesReturns the number of lines inside current subplot.
verboseVerbosity level of logger output.
Methods
apply_params_clf(self)Apply defined parameters to active subplot.
apply_params_fun(self)Apply defined parameters to active subplot.
bar(self, left, height[, width, bottom])Bar plot.
barh(self, bottom, width[, height, left])Horizontal bar plot.
boxplot(self, x[, notch, sym, vert, whis, …])Make a box and whisker plot.
clabel(self, contour, *args, **kwargs)Label a contour plot.
colorbar(self, mappable[, ticks])Add colorbar to plot.
contour(self, x, y, z, *args, **kwargs)Draw contour lines of a function.
contourf(self, x, y, z, *args, **kwargs)Draw filled contour of a function.
copy(self)Returns a shallow copy of current class.
create([class_item])This method creates an instance of a class with given type.
deepcopy(self)Returns a deep copy of current class.
errorbar(self, x, y[, xerr, yerr])Plot with error deltas in yerr and xerr.
fill_between(self, x, y1[, y2, where, …])Fill the area between two horizontal curves.
get_class_from_type(class_type)Return the class associated with input type.
get_legend(self)Returns the handler of current subplot legend.
get_legend_handles_labels(self)Return handles and labels for legend contained by the subplot.
get_lines(self)Return a list of lines contained by the subplot.
get_params(self)Returns the dictionary of class hyperparameters.
get_state(self)Returns the object state dictionary.
get_subclasses()Get all the subclasses of the calling class.
get_xticks_idx(self, xticks)Returns the position of markers to plot.
grid(self[, grid_on, axis])Draw grid for current plot.
hist(self, x, *args, **kwargs)Plot a histogram.
imshow(self, img, *args, **kwargs)Plot image.
legend(self, *args, **kwargs)Create legend for plot.
list_class_types()This method lists all types of available subclasses of calling one.
load(path)Loads object from file.
load_state(self, path)Sets the object state from file.
loglog(self, x[, y])Plot with log scaling on both the x and y axis.
matshow(self, array, *args, **kwargs)Plot an array as a matrix.
merge(self, sp)Merge input subplot to active subplot.
plot(self, x[, y])Plot a line.
plot_decision_regions(self, clf[, …])Plot decision boundaries and regions for the given classifier.
plot_fgrads(self, gradf[, n_grid_points, …])Plot function gradient directions.
plot_fun(self, func[, multipoint, …])Plot a function (used for decision functions or boundaries).
plot_path(self, path[, path_style, …])Plot a path traversed by a point.
quiver(self, U, V[, X, Y, color, linestyle, …])A quiver plot displays velocity vectors as arrows with components (u,v) at the points (x,y).
save(self, path)Save class object to file.
save_state(self, path)Store the object state to file.
scatter(self, x, y[, s, c])Scatter plot of x vs y.
semilogx(self, x[, y])Plot with log scaling on the x axis.
semilogy(self, x[, y])Plot with log scaling on the y axis.
set(self, param_name, param_value[, copy])Set a parameter of the class.
set_axisbelow(self[, axisbelow])Set axis ticks and gridlines below most artists.
set_params(self, params_dict[, copy])Set all parameters passed as a dictionary {key: value}.
set_state(self, state_dict[, copy])Sets the object state using input dictionary.
text(self, *args, **kwargs)Create a Text instance at x, y with string text.
tick_params(self, *args, **kwargs)Change the appearance of ticks and tick labels.
timed([msg])Timer decorator.
title(self, text, *args, **kwargs)Set a title for subplot.
xlabel(self, label, *args, **kwargs)Set a label for the x axis.
xlim(self[, bottom, top])Set axes x limits.
xscale(self, scale_type[, nonposx, basex])Set scale for x axis.
xticklabels(self, labels, *args, **kwargs)Set the xtick labels.
xticks(self, location_array, *args, **kwargs)Set the x-tick locations and labels.
ylabel(self, label, *args, **kwargs)Set a label for the y axis
ylim(self[, bottom, top])Set axes y limits.
yscale(self, scale_type[, nonposy, basey])Set scale for y axis.
yticklabels(self, labels, *args, **kwargs)Set the ytick labels.
yticks(self, location_array, *args, **kwargs)Set the y-tick locations and labels.
-
plot_decision_regions(self, clf, plot_background=True, levels=None, grid_limits=None, n_grid_points=30, cmap=None)[source]¶ Plot decision boundaries and regions for the given classifier.
- Parameters
- clfCClassifier
Classifier which decision function should be plotted.
- plot_backgroundbool, optional
Specifies whether to color the decision regions. Default True. in the background using a colorbar.
- levelslist or None, optional
List of levels to be plotted. If None, CArray.arange(0.5, clf.n_classes) will be plotted.
- grid_limitslist of tuple
List with a tuple of min/max limits for each axis. If None, [(0, 1), (0, 1)] limits will be used.
- n_grid_pointsint, optional
Number of grid points. Default 30.
- cmapstr or list or matplotlib.pyplot.cm or None, optional
Colormap to use. Could be a list of colors. If None and the number of dataset classes is <= 6, colors will be chosen from [‘blue’, ‘red’, ‘lightgreen’, ‘black’, ‘gray’, ‘cyan’]. Otherwise the ‘jet’ colormap will be used.
-
class
secml.figure._plots.c_plot_constraint.CPlotConstraint(sp, default_params)[source]¶ Plot constraint on bi-dimensional feature spaces.
- Attributes
class_typeDefines class type.
loggerLogger for current object.
n_linesReturns the number of lines inside current subplot.
verboseVerbosity level of logger output.
Methods
apply_params_fun(self)Apply defined parameters to active subplot.
bar(self, left, height[, width, bottom])Bar plot.
barh(self, bottom, width[, height, left])Horizontal bar plot.
boxplot(self, x[, notch, sym, vert, whis, …])Make a box and whisker plot.
clabel(self, contour, *args, **kwargs)Label a contour plot.
colorbar(self, mappable[, ticks])Add colorbar to plot.
contour(self, x, y, z, *args, **kwargs)Draw contour lines of a function.
contourf(self, x, y, z, *args, **kwargs)Draw filled contour of a function.
copy(self)Returns a shallow copy of current class.
create([class_item])This method creates an instance of a class with given type.
deepcopy(self)Returns a deep copy of current class.
errorbar(self, x, y[, xerr, yerr])Plot with error deltas in yerr and xerr.
fill_between(self, x, y1[, y2, where, …])Fill the area between two horizontal curves.
get_class_from_type(class_type)Return the class associated with input type.
get_legend(self)Returns the handler of current subplot legend.
get_legend_handles_labels(self)Return handles and labels for legend contained by the subplot.
get_lines(self)Return a list of lines contained by the subplot.
get_params(self)Returns the dictionary of class hyperparameters.
get_state(self)Returns the object state dictionary.
get_subclasses()Get all the subclasses of the calling class.
get_xticks_idx(self, xticks)Returns the position of markers to plot.
grid(self[, grid_on, axis])Draw grid for current plot.
hist(self, x, *args, **kwargs)Plot a histogram.
imshow(self, img, *args, **kwargs)Plot image.
legend(self, *args, **kwargs)Create legend for plot.
list_class_types()This method lists all types of available subclasses of calling one.
load(path)Loads object from file.
load_state(self, path)Sets the object state from file.
loglog(self, x[, y])Plot with log scaling on both the x and y axis.
matshow(self, array, *args, **kwargs)Plot an array as a matrix.
merge(self, sp)Merge input subplot to active subplot.
plot(self, x[, y])Plot a line.
plot_constraint(self, constraint[, …])Plot constraint bound.
plot_fgrads(self, gradf[, n_grid_points, …])Plot function gradient directions.
plot_fun(self, func[, multipoint, …])Plot a function (used for decision functions or boundaries).
plot_path(self, path[, path_style, …])Plot a path traversed by a point.
quiver(self, U, V[, X, Y, color, linestyle, …])A quiver plot displays velocity vectors as arrows with components (u,v) at the points (x,y).
save(self, path)Save class object to file.
save_state(self, path)Store the object state to file.
scatter(self, x, y[, s, c])Scatter plot of x vs y.
semilogx(self, x[, y])Plot with log scaling on the x axis.
semilogy(self, x[, y])Plot with log scaling on the y axis.
set(self, param_name, param_value[, copy])Set a parameter of the class.
set_axisbelow(self[, axisbelow])Set axis ticks and gridlines below most artists.
set_params(self, params_dict[, copy])Set all parameters passed as a dictionary {key: value}.
set_state(self, state_dict[, copy])Sets the object state using input dictionary.
text(self, *args, **kwargs)Create a Text instance at x, y with string text.
tick_params(self, *args, **kwargs)Change the appearance of ticks and tick labels.
timed([msg])Timer decorator.
title(self, text, *args, **kwargs)Set a title for subplot.
xlabel(self, label, *args, **kwargs)Set a label for the x axis.
xlim(self[, bottom, top])Set axes x limits.
xscale(self, scale_type[, nonposx, basex])Set scale for x axis.
xticklabels(self, labels, *args, **kwargs)Set the xtick labels.
xticks(self, location_array, *args, **kwargs)Set the x-tick locations and labels.
ylabel(self, label, *args, **kwargs)Set a label for the y axis
ylim(self[, bottom, top])Set axes y limits.
yscale(self, scale_type[, nonposy, basey])Set scale for y axis.
yticklabels(self, labels, *args, **kwargs)Set the ytick labels.
yticks(self, location_array, *args, **kwargs)Set the y-tick locations and labels.
-
plot_constraint(self, constraint, grid_limits=None, n_grid_points=30)[source]¶ Plot constraint bound.
- Parameters
- constraintCConstraint
Constraint to be plotted.
- grid_limitslist of tuple
List with a tuple of min/max limits for each axis. If None, [(0, 1), (0, 1)] limits will be used.
- n_grid_pointsint, optional
Number of grid points. Default 30.
-
class
secml.figure._plots.c_plot_ds.CPlotDataset(sp, default_params)[source]¶ Plots a Dataset.
Custom plotting parameters can be specified.
- Currently parameters default:
show_legend: True
grid: True
See also
- Attributes
class_typeDefines class type.
loggerLogger for current object.
n_linesReturns the number of lines inside current subplot.
verboseVerbosity level of logger output.
Methods
apply_params_ds(self)Apply defined parameters to active subplot.
bar(self, left, height[, width, bottom])Bar plot.
barh(self, bottom, width[, height, left])Horizontal bar plot.
boxplot(self, x[, notch, sym, vert, whis, …])Make a box and whisker plot.
clabel(self, contour, *args, **kwargs)Label a contour plot.
colorbar(self, mappable[, ticks])Add colorbar to plot.
contour(self, x, y, z, *args, **kwargs)Draw contour lines of a function.
contourf(self, x, y, z, *args, **kwargs)Draw filled contour of a function.
copy(self)Returns a shallow copy of current class.
create([class_item])This method creates an instance of a class with given type.
deepcopy(self)Returns a deep copy of current class.
errorbar(self, x, y[, xerr, yerr])Plot with error deltas in yerr and xerr.
fill_between(self, x, y1[, y2, where, …])Fill the area between two horizontal curves.
get_class_from_type(class_type)Return the class associated with input type.
get_legend(self)Returns the handler of current subplot legend.
get_legend_handles_labels(self)Return handles and labels for legend contained by the subplot.
get_lines(self)Return a list of lines contained by the subplot.
get_params(self)Returns the dictionary of class hyperparameters.
get_state(self)Returns the object state dictionary.
get_subclasses()Get all the subclasses of the calling class.
get_xticks_idx(self, xticks)Returns the position of markers to plot.
grid(self[, grid_on, axis])Draw grid for current plot.
hist(self, x, *args, **kwargs)Plot a histogram.
imshow(self, img, *args, **kwargs)Plot image.
legend(self, *args, **kwargs)Create legend for plot.
list_class_types()This method lists all types of available subclasses of calling one.
load(path)Loads object from file.
load_state(self, path)Sets the object state from file.
loglog(self, x[, y])Plot with log scaling on both the x and y axis.
matshow(self, array, *args, **kwargs)Plot an array as a matrix.
merge(self, sp)Merge input subplot to active subplot.
plot(self, x[, y])Plot a line.
plot_ds(self, dataset[, colors, markers])Plot patterns of each class with a different color/marker.
plot_path(self, path[, path_style, …])Plot a path traversed by a point.
quiver(self, U, V[, X, Y, color, linestyle, …])A quiver plot displays velocity vectors as arrows with components (u,v) at the points (x,y).
save(self, path)Save class object to file.
save_state(self, path)Store the object state to file.
scatter(self, x, y[, s, c])Scatter plot of x vs y.
semilogx(self, x[, y])Plot with log scaling on the x axis.
semilogy(self, x[, y])Plot with log scaling on the y axis.
set(self, param_name, param_value[, copy])Set a parameter of the class.
set_axisbelow(self[, axisbelow])Set axis ticks and gridlines below most artists.
set_params(self, params_dict[, copy])Set all parameters passed as a dictionary {key: value}.
set_state(self, state_dict[, copy])Sets the object state using input dictionary.
text(self, *args, **kwargs)Create a Text instance at x, y with string text.
tick_params(self, *args, **kwargs)Change the appearance of ticks and tick labels.
timed([msg])Timer decorator.
title(self, text, *args, **kwargs)Set a title for subplot.
xlabel(self, label, *args, **kwargs)Set a label for the x axis.
xlim(self[, bottom, top])Set axes x limits.
xscale(self, scale_type[, nonposx, basex])Set scale for x axis.
xticklabels(self, labels, *args, **kwargs)Set the xtick labels.
xticks(self, location_array, *args, **kwargs)Set the x-tick locations and labels.
ylabel(self, label, *args, **kwargs)Set a label for the y axis
ylim(self[, bottom, top])Set axes y limits.
yscale(self, scale_type[, nonposy, basey])Set scale for y axis.
yticklabels(self, labels, *args, **kwargs)Set the ytick labels.
yticks(self, location_array, *args, **kwargs)Set the y-tick locations and labels.
-
plot_ds(self, dataset, colors=None, markers='o', *args, **kwargs)[source]¶ Plot patterns of each class with a different color/marker.
- Parameters
- datasetCDataset
Dataset that contain samples which we want plot.
- colorslist or None, optional
Color to be used for plotting each class. If a list, each color will be assigned to a dataset’s class, with repetitions if necessary. If None and the number of classes is 1, blue will be used. If None and the number of classes is 2, blue and red will be used. If None and the number of classes is > 2, ‘jet’ colormap is used.
- markerslist or str, optional
Marker to use for plotting. Default is ‘o’ (circle). If a string, the same specified marker will be used for each class. If a list, must specify one marker for each dataset’s class.
- args, kwargsany
Any optional argument for plots. If the number of classes is 2, a plot will be created. If the number of classes is > 2, a scatter plot will be created.
-
class
secml.figure._plots.c_plot_fun.CPlotFunction(sp, default_params)[source]¶ Plots a Function.
Custom plotting parameters can be specified.
- Currently parameters default:
show_legend: True
grid: True
- Attributes
class_typeDefines class type.
loggerLogger for current object.
n_linesReturns the number of lines inside current subplot.
verboseVerbosity level of logger output.
Methods
apply_params_fun(self)Apply defined parameters to active subplot.
bar(self, left, height[, width, bottom])Bar plot.
barh(self, bottom, width[, height, left])Horizontal bar plot.
boxplot(self, x[, notch, sym, vert, whis, …])Make a box and whisker plot.
clabel(self, contour, *args, **kwargs)Label a contour plot.
colorbar(self, mappable[, ticks])Add colorbar to plot.
contour(self, x, y, z, *args, **kwargs)Draw contour lines of a function.
contourf(self, x, y, z, *args, **kwargs)Draw filled contour of a function.
copy(self)Returns a shallow copy of current class.
create([class_item])This method creates an instance of a class with given type.
deepcopy(self)Returns a deep copy of current class.
errorbar(self, x, y[, xerr, yerr])Plot with error deltas in yerr and xerr.
fill_between(self, x, y1[, y2, where, …])Fill the area between two horizontal curves.
get_class_from_type(class_type)Return the class associated with input type.
get_legend(self)Returns the handler of current subplot legend.
get_legend_handles_labels(self)Return handles and labels for legend contained by the subplot.
get_lines(self)Return a list of lines contained by the subplot.
get_params(self)Returns the dictionary of class hyperparameters.
get_state(self)Returns the object state dictionary.
get_subclasses()Get all the subclasses of the calling class.
get_xticks_idx(self, xticks)Returns the position of markers to plot.
grid(self[, grid_on, axis])Draw grid for current plot.
hist(self, x, *args, **kwargs)Plot a histogram.
imshow(self, img, *args, **kwargs)Plot image.
legend(self, *args, **kwargs)Create legend for plot.
list_class_types()This method lists all types of available subclasses of calling one.
load(path)Loads object from file.
load_state(self, path)Sets the object state from file.
loglog(self, x[, y])Plot with log scaling on both the x and y axis.
matshow(self, array, *args, **kwargs)Plot an array as a matrix.
merge(self, sp)Merge input subplot to active subplot.
plot(self, x[, y])Plot a line.
plot_fgrads(self, gradf[, n_grid_points, …])Plot function gradient directions.
plot_fun(self, func[, multipoint, …])Plot a function (used for decision functions or boundaries).
plot_path(self, path[, path_style, …])Plot a path traversed by a point.
quiver(self, U, V[, X, Y, color, linestyle, …])A quiver plot displays velocity vectors as arrows with components (u,v) at the points (x,y).
save(self, path)Save class object to file.
save_state(self, path)Store the object state to file.
scatter(self, x, y[, s, c])Scatter plot of x vs y.
semilogx(self, x[, y])Plot with log scaling on the x axis.
semilogy(self, x[, y])Plot with log scaling on the y axis.
set(self, param_name, param_value[, copy])Set a parameter of the class.
set_axisbelow(self[, axisbelow])Set axis ticks and gridlines below most artists.
set_params(self, params_dict[, copy])Set all parameters passed as a dictionary {key: value}.
set_state(self, state_dict[, copy])Sets the object state using input dictionary.
text(self, *args, **kwargs)Create a Text instance at x, y with string text.
tick_params(self, *args, **kwargs)Change the appearance of ticks and tick labels.
timed([msg])Timer decorator.
title(self, text, *args, **kwargs)Set a title for subplot.
xlabel(self, label, *args, **kwargs)Set a label for the x axis.
xlim(self[, bottom, top])Set axes x limits.
xscale(self, scale_type[, nonposx, basex])Set scale for x axis.
xticklabels(self, labels, *args, **kwargs)Set the xtick labels.
xticks(self, location_array, *args, **kwargs)Set the x-tick locations and labels.
ylabel(self, label, *args, **kwargs)Set a label for the y axis
ylim(self[, bottom, top])Set axes y limits.
yscale(self, scale_type[, nonposy, basey])Set scale for y axis.
yticklabels(self, labels, *args, **kwargs)Set the ytick labels.
yticks(self, location_array, *args, **kwargs)Set the y-tick locations and labels.
-
plot_fgrads(self, gradf, n_grid_points=30, grid_limits=None, color='k', linestyle='-', linewidth=1.0, alpha=1.0, func_args=(), **func_kwargs)[source]¶ Plot function gradient directions.
- Parameters
- gradffunction
Function that computes gradient directions.
- n_grid_pointsint
Number of grid points.
- grid_limitslist of tuple
List with a tuple of min/max limits for each axis. If None, [(0, 1), (0, 1)] limits will be used.
- color :
Color of the gradient directions.
- linestylestr
[‘solid’ | ‘dashed’, ‘dashdot’, ‘dotted’ | (offset, on-off-dash-seq) | ‘-’ | ‘–’ | ‘-.’ | ‘:’ | ‘None’ | ‘ ‘ | ‘’]
- linewidthfloat
Width of the line.
- alphafloat
Transparency factor of the directions.
- func_args, func_kwargsany
Other arguments or keyword arguments to pass to gradf.
-
plot_fun(self, func, multipoint=False, plot_background=True, plot_levels=True, levels=None, levels_color='k', levels_style=None, levels_linewidth=1.0, n_colors=50, cmap='jet', alpha=1.0, alpha_levels=1.0, vmin=None, vmax=None, colorbar=True, n_grid_points=30, grid_limits=None, func_args=(), **func_kwargs)[source]¶ Plot a function (used for decision functions or boundaries).
- Parameters
- funcunbound function
Function to be plotted.
- multipointbool, optional
If True, all grid points will be passed to the function. If False (default), function is iterated over each point of the grid.
- plot_backgroundbool, optional
Specifies whether to plot the value of func at each point in the background using a colorbar.
- plot_levelsbool, optional
Specify if function levels should be plotted (default True).
- levelslist or None, optional
List of levels to be plotted. If None, 0 (zero) level will be plotted.
- levels_colorstr or tuple or None, optional
If None, the colormap specified by cmap will be used. If a string, like ‘k’, all levels will be plotted in this color. If a tuple of colors (string, float, rgb, etc), different levels will be plotted in different colors in the order specified. Default ‘k’.
- levels_style[ None | ‘solid’ | ‘dashed’ | ‘dashdot’ | ‘dotted’ ]
If levels_style is None, the default is ‘solid’. levels_style can also be an iterable of the above strings specifying a set of levels_style to be used. If this iterable is shorter than the number of contour levels it will be repeated as necessary.
- levels_linewidthfloat or list of floats, optional
The line width of the contour lines. Default 1.0.
- n_colorsint, optional
Number of color levels of background plot. Default 50.
- cmapstr or list or matplotlib.pyplot.cm, optional
Colormap to use (default ‘jet’). Could be a list of colors.
- alphafloat, optional
The alpha blending value of the background. Default 1.0.
- alpha_levelsfloat, optional
The alpha blending value of the levels. Default 1.0.
- vmin, vmaxfloat or None, optional
Limits of the colors used for function plotting. If None, colors are determined by the colormap.
- colorbarbool, optional
True if colorbar should be displayed.
- n_grid_pointsint, optional
Number of grid points.
- grid_limitslist of tuple, optional
List with a tuple of min/max limits for each axis. If None, [(0, 1), (0, 1)] limits will be used.
- func_args, func_kwargs
Other arguments or keyword arguments to pass to func.
Examples
from secml.array import CArray
from secml.figure import CFigure


# we must define a function that take an array and return a value for every row
def f(array):
    res = CArray.zeros(array.shape[0])
    for r in range(array.shape[0]):
        x = array[r, 0]
        y = array[r, 1]
        res[r] = x + y
    return res


fig = CFigure()

fig.sp.plot_fun(f, levels=[.5, 1, 1.5])

fig.sp.grid()
fig.show()
(Source code, png)

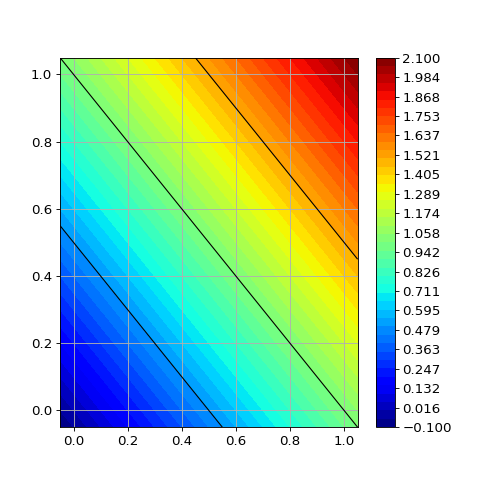
-
class
secml.figure._plots.c_plot_metric.CPlotMetric(sp, default_params)[source]¶ Plots of performance evaluation metrics.
- Currently parameters default for ROC plots:
show_legend: True
ylabel: ‘True Positive Rate (%)’
xlabel: ‘False Positive Rate (%)’
yticks: [0, 20, 40, 60, 80, 100]
yticklabels: see yticks
xticks: list. [0.1, 0.5, 1, 2, 5, 10, 20, 50, 100]
xticklabels: see xticks
ylim: (0.1, 100)
xlim: (0, 100)
grid: True
- Attributes
class_typeDefines class type.
loggerLogger for current object.
n_linesReturns the number of lines inside current subplot.
verboseVerbosity level of logger output.
Methods
apply_params_roc(self)Apply defined parameters to active subplot.
bar(self, left, height[, width, bottom])Bar plot.
barh(self, bottom, width[, height, left])Horizontal bar plot.
boxplot(self, x[, notch, sym, vert, whis, …])Make a box and whisker plot.
clabel(self, contour, *args, **kwargs)Label a contour plot.
colorbar(self, mappable[, ticks])Add colorbar to plot.
contour(self, x, y, z, *args, **kwargs)Draw contour lines of a function.
contourf(self, x, y, z, *args, **kwargs)Draw filled contour of a function.
copy(self)Returns a shallow copy of current class.
create([class_item])This method creates an instance of a class with given type.
deepcopy(self)Returns a deep copy of current class.
errorbar(self, x, y[, xerr, yerr])Plot with error deltas in yerr and xerr.
fill_between(self, x, y1[, y2, where, …])Fill the area between two horizontal curves.
get_class_from_type(class_type)Return the class associated with input type.
get_legend(self)Returns the handler of current subplot legend.
get_legend_handles_labels(self)Return handles and labels for legend contained by the subplot.
get_lines(self)Return a list of lines contained by the subplot.
get_params(self)Returns the dictionary of class hyperparameters.
get_state(self)Returns the object state dictionary.
get_subclasses()Get all the subclasses of the calling class.
get_xticks_idx(self, xticks)Returns the position of markers to plot.
grid(self[, grid_on, axis])Draw grid for current plot.
hist(self, x, *args, **kwargs)Plot a histogram.
imshow(self, img, *args, **kwargs)Plot image.
legend(self, *args, **kwargs)Create legend for plot.
list_class_types()This method lists all types of available subclasses of calling one.
load(path)Loads object from file.
load_state(self, path)Sets the object state from file.
loglog(self, x[, y])Plot with log scaling on both the x and y axis.
matshow(self, array, *args, **kwargs)Plot an array as a matrix.
merge(self, sp)Merge input subplot to active subplot.
plot(self, x[, y])Plot a line.
plot_confusion_matrix(self, y_true, y_pred)Plot a confusion matrix.
plot_path(self, path[, path_style, …])Plot a path traversed by a point.
plot_roc(self, fpr, tpr[, label, style, logx])Plot a ROC curve given input fpr and tpr.
plot_roc_mean(self, roc[, label, …])Plot the mean of ROC curves.
plot_roc_reps(self, roc[, label, …])Plot all input ROC curves.
quiver(self, U, V[, X, Y, color, linestyle, …])A quiver plot displays velocity vectors as arrows with components (u,v) at the points (x,y).
save(self, path)Save class object to file.
save_state(self, path)Store the object state to file.
scatter(self, x, y[, s, c])Scatter plot of x vs y.
semilogx(self, x[, y])Plot with log scaling on the x axis.
semilogy(self, x[, y])Plot with log scaling on the y axis.
set(self, param_name, param_value[, copy])Set a parameter of the class.
set_axisbelow(self[, axisbelow])Set axis ticks and gridlines below most artists.
set_params(self, params_dict[, copy])Set all parameters passed as a dictionary {key: value}.
set_state(self, state_dict[, copy])Sets the object state using input dictionary.
text(self, *args, **kwargs)Create a Text instance at x, y with string text.
tick_params(self, *args, **kwargs)Change the appearance of ticks and tick labels.
timed([msg])Timer decorator.
title(self, text, *args, **kwargs)Set a title for subplot.
xlabel(self, label, *args, **kwargs)Set a label for the x axis.
xlim(self[, bottom, top])Set axes x limits.
xscale(self, scale_type[, nonposx, basex])Set scale for x axis.
xticklabels(self, labels, *args, **kwargs)Set the xtick labels.
xticks(self, location_array, *args, **kwargs)Set the x-tick locations and labels.
ylabel(self, label, *args, **kwargs)Set a label for the y axis
ylim(self[, bottom, top])Set axes y limits.
yscale(self, scale_type[, nonposy, basey])Set scale for y axis.
yticklabels(self, labels, *args, **kwargs)Set the ytick labels.
yticks(self, location_array, *args, **kwargs)Set the y-tick locations and labels.
-
plot_confusion_matrix(self, y_true, y_pred, normalize=False, labels=None, title=None, cmap='Blues', colorbar=False)[source]¶ Plot a confusion matrix.
- y_trueCArray
True labels.
- y_predCArray
Predicted labels.
- normalizebool, optional
If True, normalize the confusion matrix in 0/1. Default False.
- labelslist, optional
List with the label of each class.
- title: str, optional
Title of the plot. Default None.
- cmap: str or matplotlib.pyplot.cm, optional
Colormap to use for plotting. Default ‘Blues’.
- colorbarbool, optional
If True, show the colorbar side of the matrix. Default False.
-
plot_roc(self, fpr, tpr, label=None, style=None, logx=True)[source]¶ Plot a ROC curve given input fpr and tpr.
Curves will be plotted inside the active figure or a new figure will be created using default parameters.
- Parameters
- fprCArray
Array with False Positive Rats.
- tprCArray
Array with False Positive Rates.
- labelstr or None, optional
Label to assign to the roc.
- stylestr or None, optional
Style of the roc plot.
- logxbool, optional
If True (default), logarithmic scale will be used for fpr axis.
- Returns
- roc_plotCFigure
Figure after this plot session.
-
plot_roc_mean(self, roc, label=None, invert_tpr=False, style=None, plot_std=False, logx=True)[source]¶ Plot the mean of ROC curves.
Curves will be plotted inside the active figure or a new figure will be created using default parameters.
- Parameters
- rocCRoc
Roc curves to plot.
- labelstr or None, optional
Label to assign to the roc.
- invert_tprbool
True if 1 - tpr (False Negative Rates) should be plotted on y axis. Default False.
- stylestr or None, optional
Style of the roc plot. If a string, must follow the matplotlib convention: ‘[color][marker][line]’.
- plot_stdbool (default False)
If True, standard deviation of True Positive Rates will be plotted.
- logxbool, optional
If True (default), logarithmic scale will be used for fpr axis.
- Returns
- roc_plotCFigure
Figure after this plot session.
-
plot_roc_reps(self, roc, label=None, invert_tpr=False, logx=True)[source]¶ Plot all input ROC curves.
Curves will be plotted inside the active figure or a new figure will be created using default parameters.
- Parameters
- rocCRoc
Roc curves to plot.
- labelstr or None, optional
Label to assign to the roc. Repetition number will be appended using the following convention:
If label is None -> “rep ‘i’”
If label is not None -> “label (rep i)”
- invert_tprbool
True if 1 - tpr (False Negative Rates) should be plotted on y axis. Default False.
- logxbool, optional
If True (default), logarithmic scale will be used for fpr axis.
- Returns
- roc_plotCFigure
Figure after this plot session.
-
class
secml.figure._plots.c_plot_sec_eval.CPlotSecEval(sp, default_params)[source]¶ Plots Classifier Security Evaluation results.
This class creates a figure plotting in a fancy and standard style data from .CSecEvalData class.
Custom plotting parameters can be specified.
- Currently parameters default:
show_legend: True. Set False to hide show_legend on next plot.
grid: True.
- Attributes
class_typeDefines class type.
loggerLogger for current object.
n_linesReturns the number of lines inside current subplot.
verboseVerbosity level of logger output.
Methods
apply_params_sec_eval(self)Apply defined parameters to active subplot.
bar(self, left, height[, width, bottom])Bar plot.
barh(self, bottom, width[, height, left])Horizontal bar plot.
boxplot(self, x[, notch, sym, vert, whis, …])Make a box and whisker plot.
clabel(self, contour, *args, **kwargs)Label a contour plot.
colorbar(self, mappable[, ticks])Add colorbar to plot.
contour(self, x, y, z, *args, **kwargs)Draw contour lines of a function.
contourf(self, x, y, z, *args, **kwargs)Draw filled contour of a function.
copy(self)Returns a shallow copy of current class.
create([class_item])This method creates an instance of a class with given type.
deepcopy(self)Returns a deep copy of current class.
errorbar(self, x, y[, xerr, yerr])Plot with error deltas in yerr and xerr.
fill_between(self, x, y1[, y2, where, …])Fill the area between two horizontal curves.
get_class_from_type(class_type)Return the class associated with input type.
get_legend(self)Returns the handler of current subplot legend.
get_legend_handles_labels(self)Return handles and labels for legend contained by the subplot.
get_lines(self)Return a list of lines contained by the subplot.
get_params(self)Returns the dictionary of class hyperparameters.
get_state(self)Returns the object state dictionary.
get_subclasses()Get all the subclasses of the calling class.
get_xticks_idx(self, xticks)Returns the position of markers to plot.
grid(self[, grid_on, axis])Draw grid for current plot.
hist(self, x, *args, **kwargs)Plot a histogram.
imshow(self, img, *args, **kwargs)Plot image.
legend(self, *args, **kwargs)Create legend for plot.
list_class_types()This method lists all types of available subclasses of calling one.
load(path)Loads object from file.
load_state(self, path)Sets the object state from file.
loglog(self, x[, y])Plot with log scaling on both the x and y axis.
matshow(self, array, *args, **kwargs)Plot an array as a matrix.
merge(self, sp)Merge input subplot to active subplot.
plot(self, x[, y])Plot a line.
plot_path(self, path[, path_style, …])Plot a path traversed by a point.
plot_sec_eval(self, sec_eval_data[, metric, …])Plot the Security Evaluation Curve using desired metric.
quiver(self, U, V[, X, Y, color, linestyle, …])A quiver plot displays velocity vectors as arrows with components (u,v) at the points (x,y).
save(self, path)Save class object to file.
save_state(self, path)Store the object state to file.
scatter(self, x, y[, s, c])Scatter plot of x vs y.
semilogx(self, x[, y])Plot with log scaling on the x axis.
semilogy(self, x[, y])Plot with log scaling on the y axis.
set(self, param_name, param_value[, copy])Set a parameter of the class.
set_axisbelow(self[, axisbelow])Set axis ticks and gridlines below most artists.
set_params(self, params_dict[, copy])Set all parameters passed as a dictionary {key: value}.
set_state(self, state_dict[, copy])Sets the object state using input dictionary.
text(self, *args, **kwargs)Create a Text instance at x, y with string text.
tick_params(self, *args, **kwargs)Change the appearance of ticks and tick labels.
timed([msg])Timer decorator.
title(self, text, *args, **kwargs)Set a title for subplot.
xlabel(self, label, *args, **kwargs)Set a label for the x axis.
xlim(self[, bottom, top])Set axes x limits.
xscale(self, scale_type[, nonposx, basex])Set scale for x axis.
xticklabels(self, labels, *args, **kwargs)Set the xtick labels.
xticks(self, location_array, *args, **kwargs)Set the x-tick locations and labels.
ylabel(self, label, *args, **kwargs)Set a label for the y axis
ylim(self[, bottom, top])Set axes y limits.
yscale(self, scale_type[, nonposy, basey])Set scale for y axis.
yticklabels(self, labels, *args, **kwargs)Set the ytick labels.
yticks(self, location_array, *args, **kwargs)Set the y-tick locations and labels.
-
plot_sec_eval(self, sec_eval_data, metric='accuracy', mean=False, percentage=False, show_average=False, label=None, linestyle='-', color=None, marker=None, metric_args=())[source]¶ Plot the Security Evaluation Curve using desired metric.
- Parameters
- sec_eval_dataCSecEvalData or list
A single CSecEvalData object or a list with multiple repetitions.
- metricstr or CMetric, optional
Metric to be evaluated. Default ‘accuracy’.
- meanbool, optional
If True, the mean of all sec eval repetitions will be computed. Default False..
- percentagebool, optional
If True, values will be displayed in percentage. Default False.
- show_averagebool, optional
If True, the average along the sec eval parameters will be shown in legend. Default False.
- labelstr, optional
Label of the sec eval curve. Default None.
- linestylestr, optional
Style of the curve. Default ‘-‘.
- colorstr or None, optional
Color of the curve. If None (default) the plot engine will chose.
- markerstr or None, optional
Style of the markers. Default None.
- metric_args
Any other argument for the metric.
-
class
secml.figure._plots.c_plot_stats.CPlotStats(sp, default_params)[source]¶ Plots for statistical functions.
Custom plotting parameters can be specified.
- Currently parameters default:
show_legend: True.
grid: True.
See also
CPlotbasic subplot functions.
CFigurecreates and handle figures.
- Attributes
class_typeDefines class type.
loggerLogger for current object.
n_linesReturns the number of lines inside current subplot.
verboseVerbosity level of logger output.
Methods
apply_params_stats(self)Apply defined parameters to active subplot.
bar(self, left, height[, width, bottom])Bar plot.
barh(self, bottom, width[, height, left])Horizontal bar plot.
boxplot(self, x[, notch, sym, vert, whis, …])Make a box and whisker plot.
clabel(self, contour, *args, **kwargs)Label a contour plot.
colorbar(self, mappable[, ticks])Add colorbar to plot.
contour(self, x, y, z, *args, **kwargs)Draw contour lines of a function.
contourf(self, x, y, z, *args, **kwargs)Draw filled contour of a function.
copy(self)Returns a shallow copy of current class.
create([class_item])This method creates an instance of a class with given type.
deepcopy(self)Returns a deep copy of current class.
errorbar(self, x, y[, xerr, yerr])Plot with error deltas in yerr and xerr.
fill_between(self, x, y1[, y2, where, …])Fill the area between two horizontal curves.
get_class_from_type(class_type)Return the class associated with input type.
get_legend(self)Returns the handler of current subplot legend.
get_legend_handles_labels(self)Return handles and labels for legend contained by the subplot.
get_lines(self)Return a list of lines contained by the subplot.
get_params(self)Returns the dictionary of class hyperparameters.
get_state(self)Returns the object state dictionary.
get_subclasses()Get all the subclasses of the calling class.
get_xticks_idx(self, xticks)Returns the position of markers to plot.
grid(self[, grid_on, axis])Draw grid for current plot.
hist(self, x, *args, **kwargs)Plot a histogram.
imshow(self, img, *args, **kwargs)Plot image.
legend(self, *args, **kwargs)Create legend for plot.
list_class_types()This method lists all types of available subclasses of calling one.
load(path)Loads object from file.
load_state(self, path)Sets the object state from file.
loglog(self, x[, y])Plot with log scaling on both the x and y axis.
matshow(self, array, *args, **kwargs)Plot an array as a matrix.
merge(self, sp)Merge input subplot to active subplot.
plot(self, x[, y])Plot a line.
plot_path(self, path[, path_style, …])Plot a path traversed by a point.
plot_prob_density(self, scores, ts, **params)Plot density estimation of benign and malicious class.
quiver(self, U, V[, X, Y, color, linestyle, …])A quiver plot displays velocity vectors as arrows with components (u,v) at the points (x,y).
save(self, path)Save class object to file.
save_state(self, path)Store the object state to file.
scatter(self, x, y[, s, c])Scatter plot of x vs y.
semilogx(self, x[, y])Plot with log scaling on the x axis.
semilogy(self, x[, y])Plot with log scaling on the y axis.
set(self, param_name, param_value[, copy])Set a parameter of the class.
set_axisbelow(self[, axisbelow])Set axis ticks and gridlines below most artists.
set_params(self, params_dict[, copy])Set all parameters passed as a dictionary {key: value}.
set_state(self, state_dict[, copy])Sets the object state using input dictionary.
text(self, *args, **kwargs)Create a Text instance at x, y with string text.
tick_params(self, *args, **kwargs)Change the appearance of ticks and tick labels.
timed([msg])Timer decorator.
title(self, text, *args, **kwargs)Set a title for subplot.
xlabel(self, label, *args, **kwargs)Set a label for the x axis.
xlim(self[, bottom, top])Set axes x limits.
xscale(self, scale_type[, nonposx, basex])Set scale for x axis.
xticklabels(self, labels, *args, **kwargs)Set the xtick labels.
xticks(self, location_array, *args, **kwargs)Set the x-tick locations and labels.
ylabel(self, label, *args, **kwargs)Set a label for the y axis
ylim(self[, bottom, top])Set axes y limits.
yscale(self, scale_type[, nonposy, basey])Set scale for y axis.
yticklabels(self, labels, *args, **kwargs)Set the ytick labels.
yticks(self, location_array, *args, **kwargs)Set the y-tick locations and labels.